Thanks to Heather Willocks of Balclutha Primary School for sending these photos of her students taking part in CensusAtSchool.
Thanks to Heather Willocks of Balclutha Primary School for sending these photos of her students taking part in CensusAtSchool.
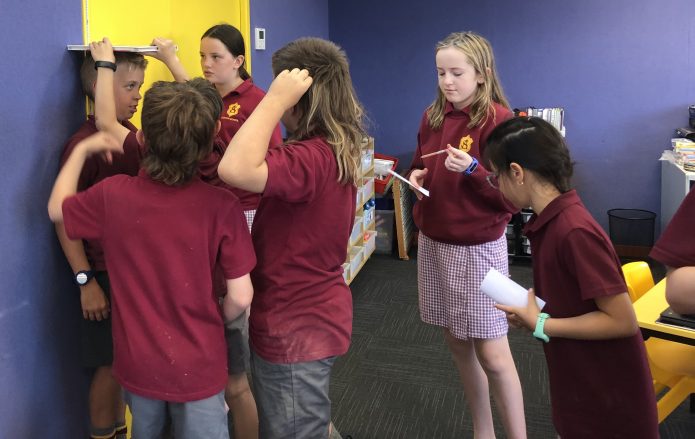
Thanks to Christine Moore of Allenton School in Ashburton for sending this photo of Year 5 and 6 students taking part in CensusAtSchool.
Kia ora koutou,
We have just hit the first 10,000 students taking part in CensusAtSchool! Thank you so much for getting involved! We’ll be releasing the national database for sampling from shortly.
The questionnaire is open all year. We encourage you to take part as soon as possible, but whenever it suits you best is fine.
With the national census currently taking place, CensusAtSchool is a great complementary topical activity.


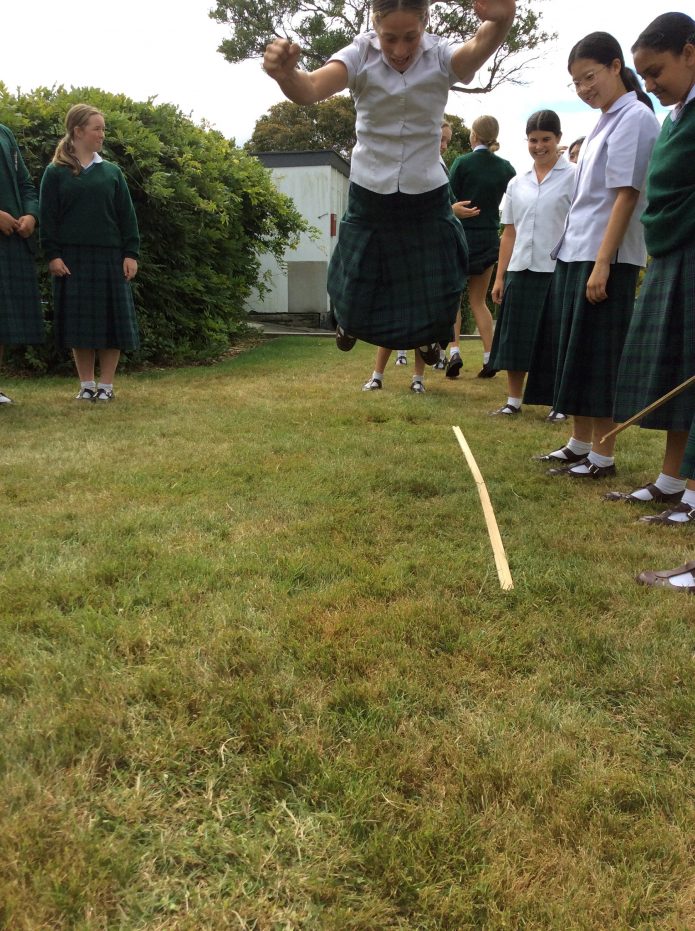
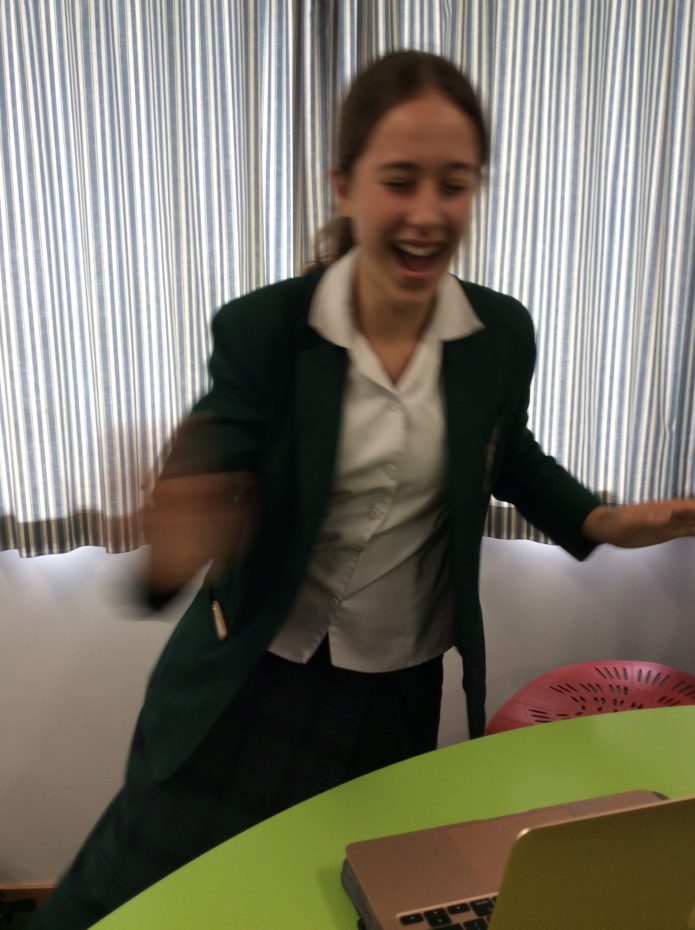
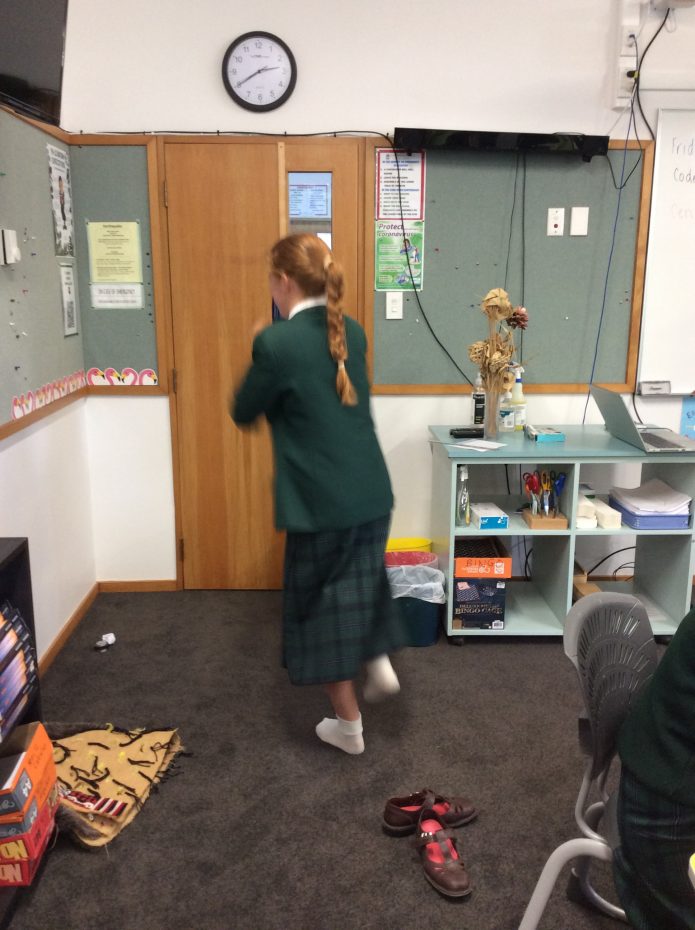
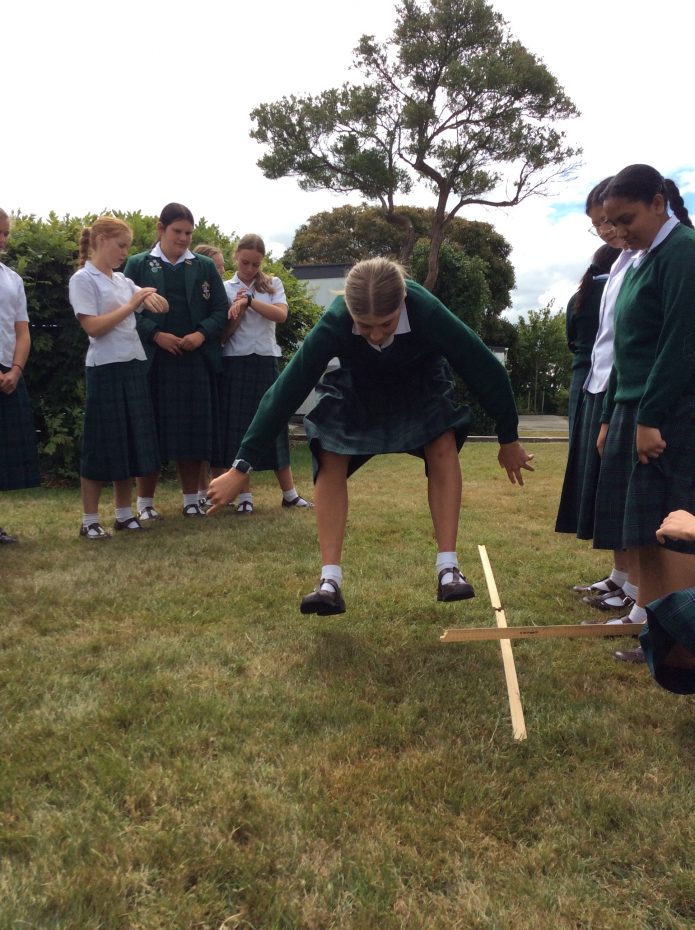
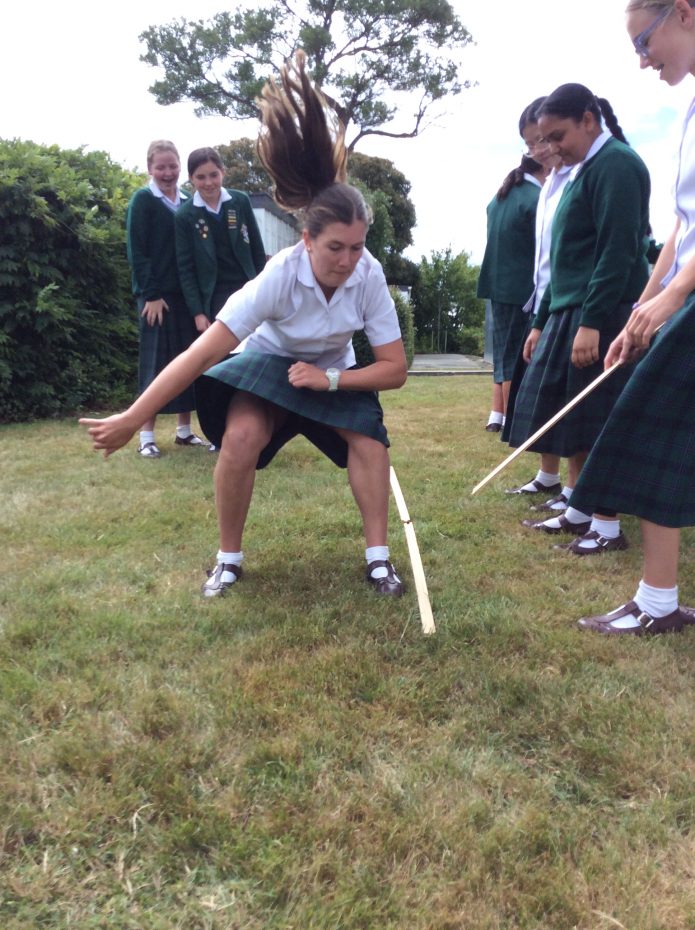
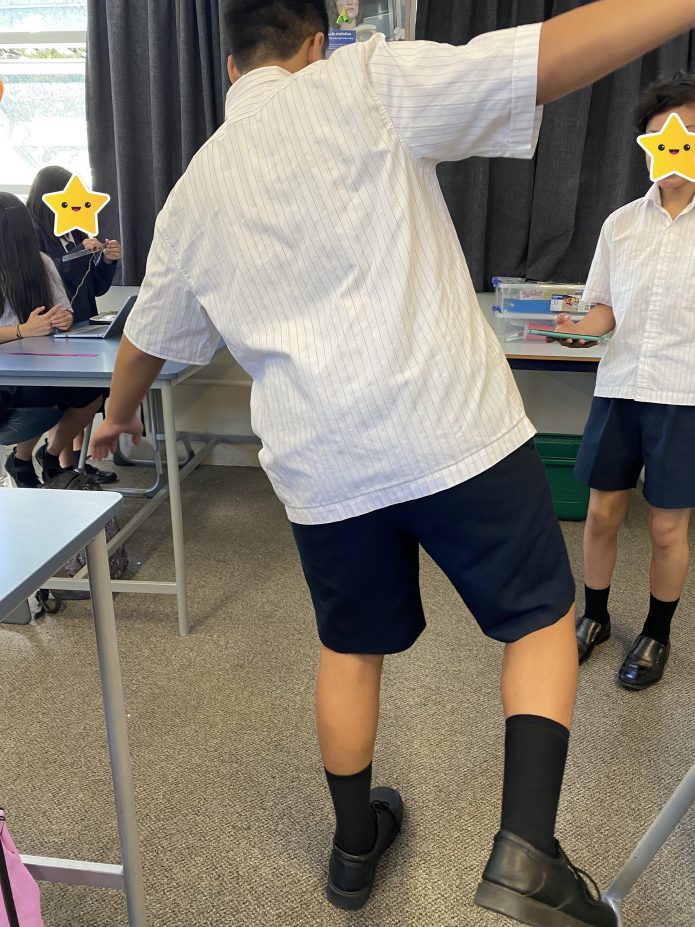
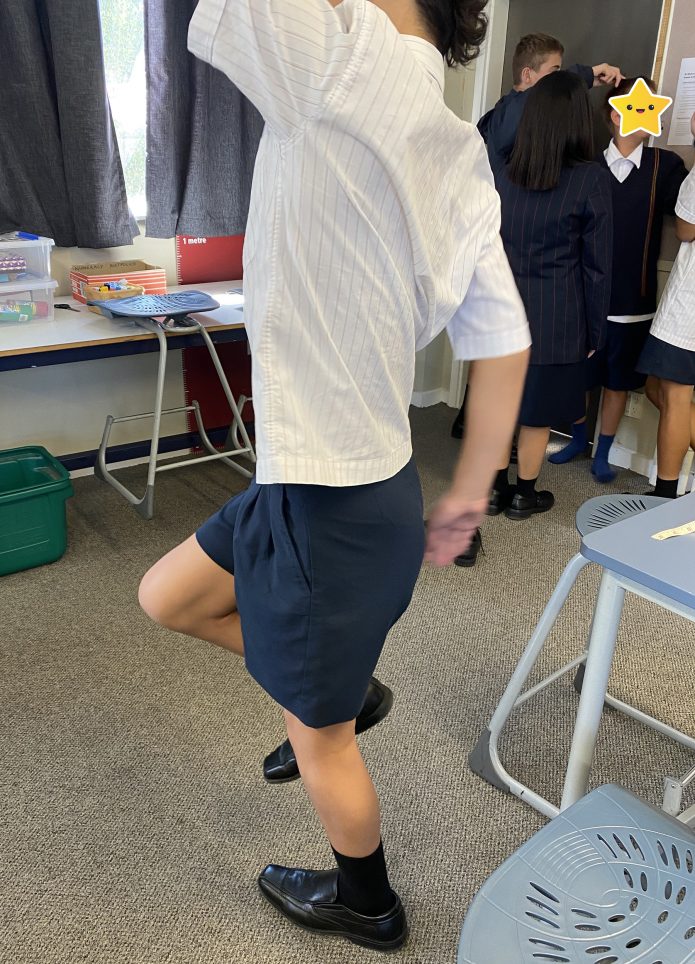
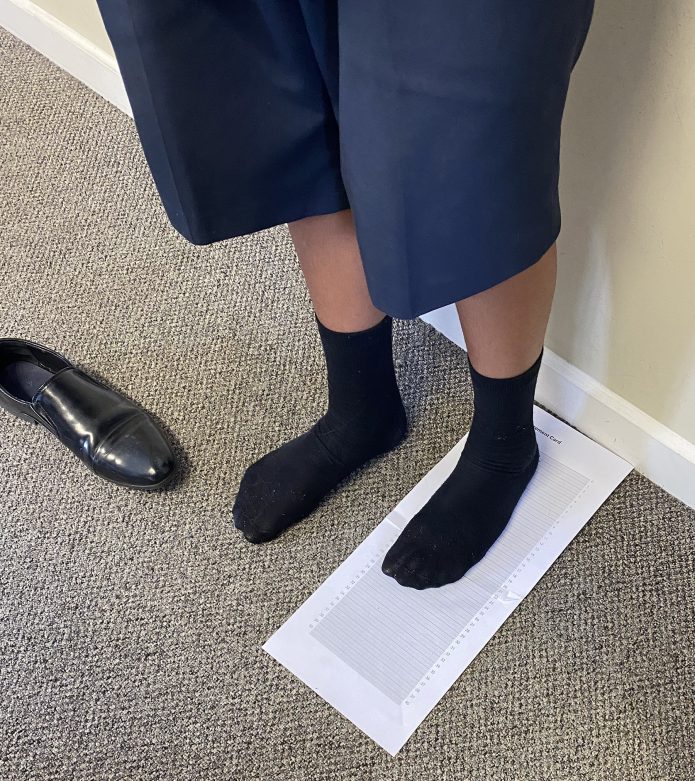
Thanks to Kelly Dawe, Head of Mathematics at Craighead Diocesan School for sharing these photos of her Year 10 maths class taking part in CensusAtSchool.
Can’t remember if you have registered or not?
Check by entering your email here. If your email doesn’t come up, register here. It’s never too late to register and take part.
Can’t find your registration code?
Get it again here
Unsure when you can take part?
Any time during school hours from Monday – it doesn’t need to be next week if it’s not convenient. The survey is open all year.
Need help preparing?
Please ensure that you have read the essential Teacher’s Guide. All the equipment needed to take part successfully with your students is included in it.
Want to take part over multiple days?
You can divide the activity into two sessions. Use the first session to take the measurements and fill in your data cards. Use the second session to fill in the survey online. The survey itself needs to be completed in one sitting by a student. However, different students from your class can fill it in on different days, for example if you have limited devices or some students are away.
Have another question?
Reply to this email and we’ll get right back to you! Or you can call Rachel Cunliffe on (027) 383-3746.
Ngā mihi nui,
Rachel, Anne, Pip, and Chris
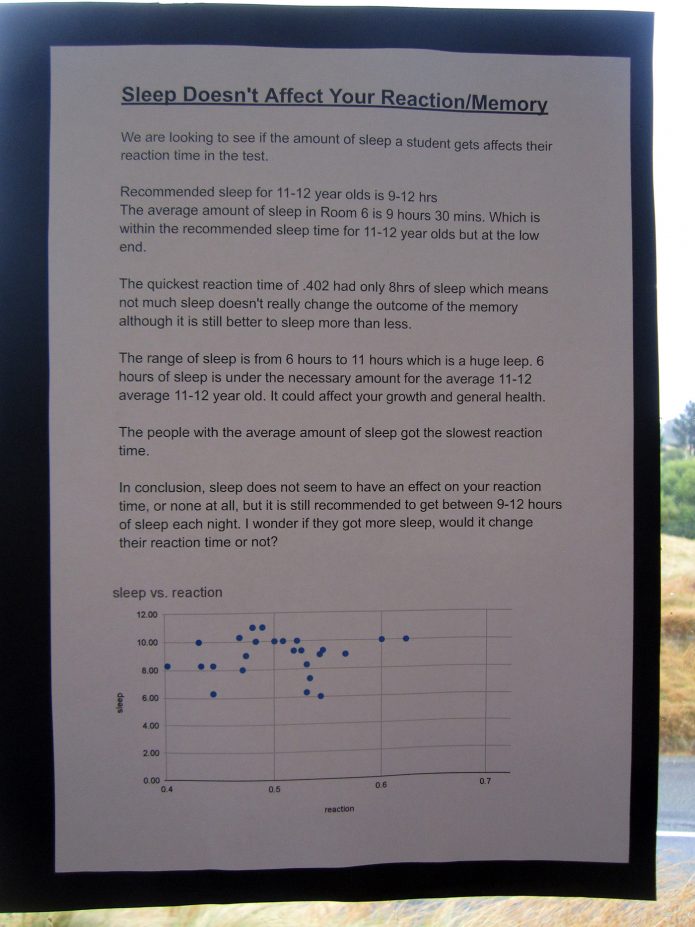
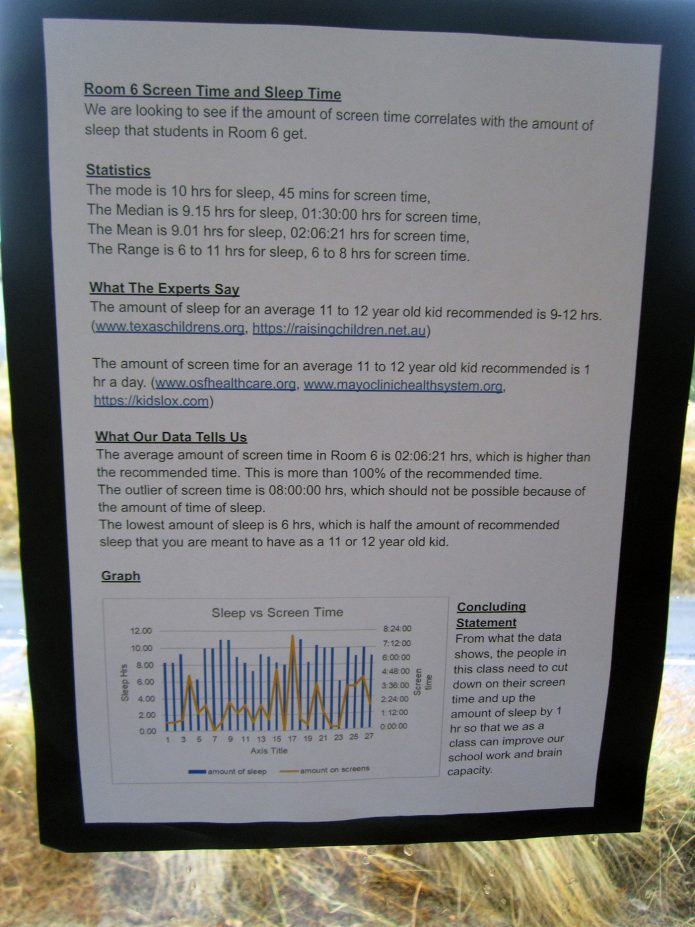
Thanks to Libby Benson for sharing these photos of her Year 7 students at Barton Rural School reports about CensusAtSchool data.


Kia ora koutou,
It’s been… a week. What a week…
To all who have been impacted by Cyclone Gabrielle in ways large and small, we acknowledge your grief over the lives lost and the loss of life as it was. It is a lot to bear.
To everyone, thank you for your flexibility with us and taking part in CensusAtSchool with your students. It’s so lovely to hear such positive feedback from you amongst the week’s news – how CensusAtSchool remains such a wonderful experience for your classes and a great way for them to get to know more about each other at the start of the year.
The questionnaire is now live and open all year. We encourage you to take part as soon as possible so that we can launch the nationwide database once we get to about 10,000 responses, but whenever it suits you best is fine.


Thanks to Carmen Kenton of Riccarton High School for sending in these photos of her Year 9 classes taking part.

Thanks to Fiona Bester at Ashgrove School in Rangiora for sharing this photo of her class taking part.

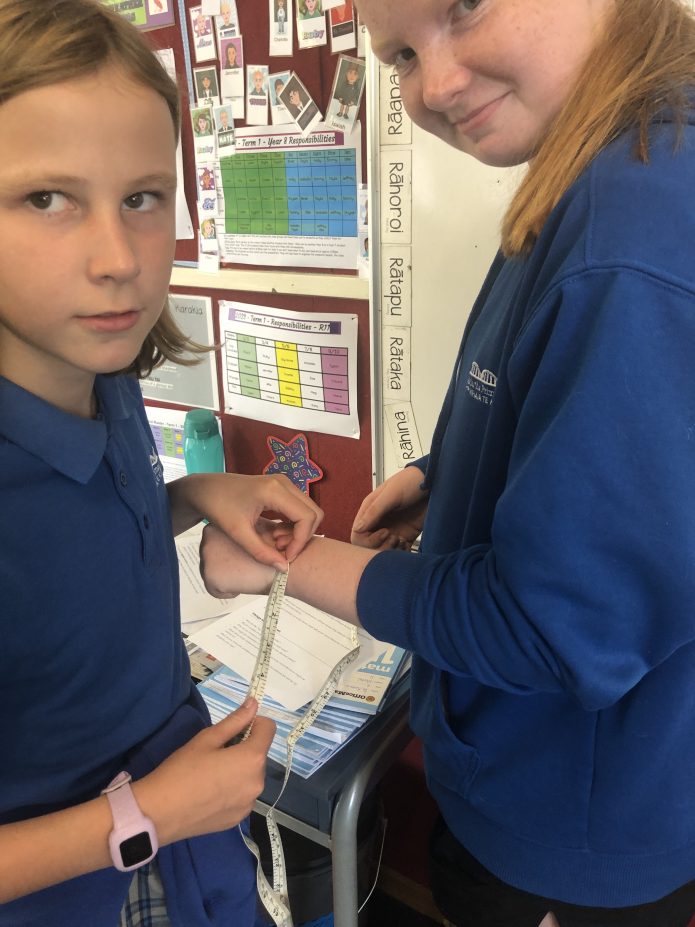
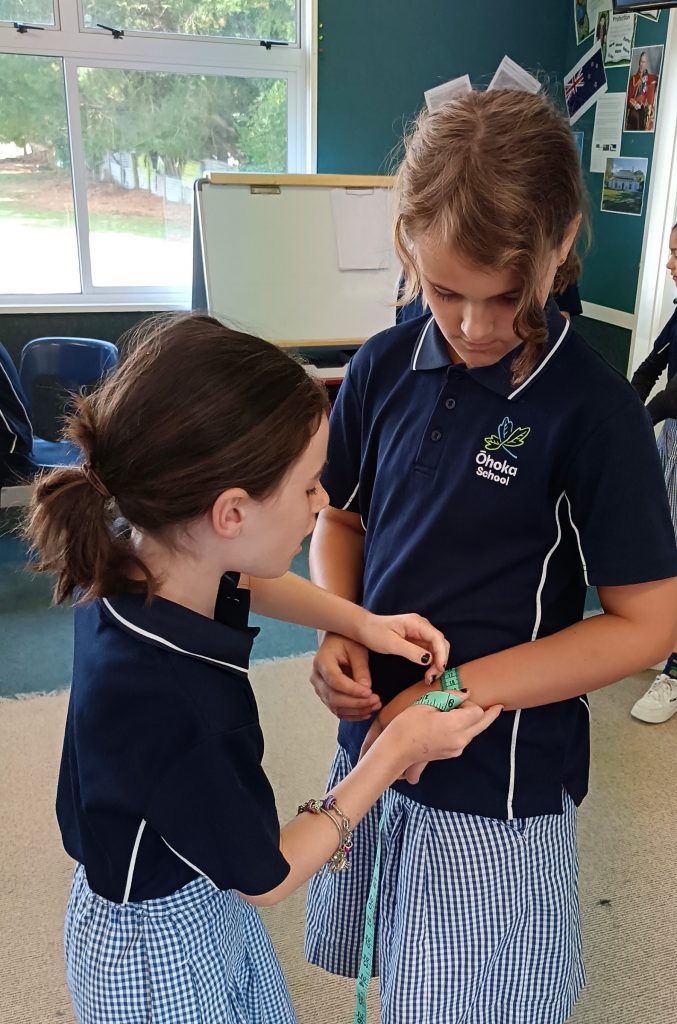
Thank you to Scott Pritchard for sharing this photo of his year 5/6 Korimako classes having fun measuring wrists accurately.
Can’t remember if you have registered or not?
Check by entering your email here. If your email doesn’t come up, register here. It’s never too late to register and take part.
Can’t find your registration code?
Get it again here
Unsure when you can take part?
Any time during school hours from Monday – it doesn’t need to be next week if it’s not convenient. The survey is open all year.
Need help preparing?
Please ensure that you have read the essential Teacher’s Guide. All the equipment needed to take part successfully with your students is included in it.
Want to take part over multiple days?
You can divide the activity into two sessions. Use the first session to take the measurements and fill in your data cards. Use the second session to fill in the survey online. The survey itself needs to be completed in one sitting by a student. However, different students from your class can fill it in on different days, for example if you have limited devices or some students are away.
Have another question?
Reply to this email and we’ll get right back to you! Or you can call Rachel Cunliffe on (027) 383-3746.
Ngā mihi nui,
Rachel, Anne, Pip, and Chris
Thanks to Carmen Kenton of Riccarton High School for sending in these photos of her Year 9 classes taking part in CensusAtschool 2023.
Thanks to Fiona Bester at Ashgrove School in Rangiora for sharing this photo of her class taking part in CensusAtSchool.
CensusAtSchool New Zealand – TataurangaKiTeKura Aotearoa celebrates the launch of their eleventh biennial survey today to once again comprehensively chart students’ views of their own lives. The large national survey will give another intriguing glimpse into school students’ lives.
Thousands of primary, intermediate, and secondary school students around the country will share their views on issues as wide-ranging as their favourite ice cream flavour, the amount of time they spend on digital devices, whether or not they have blocked someone in the past week, opinions on alcohol, how many close friends they have, how happy they say they are overall, and their favourite sport to play.
The students are taking part in CensusAtSchool New Zealand – TataurangaKiTeKura Aotearoa, a non-profit, online educational project that aims to bring statistics to life in both English and Māori-medium classrooms. It is run by the Department of Statistics at the University of Auckland in partnership with the Ministry of Education and Stats NZ.
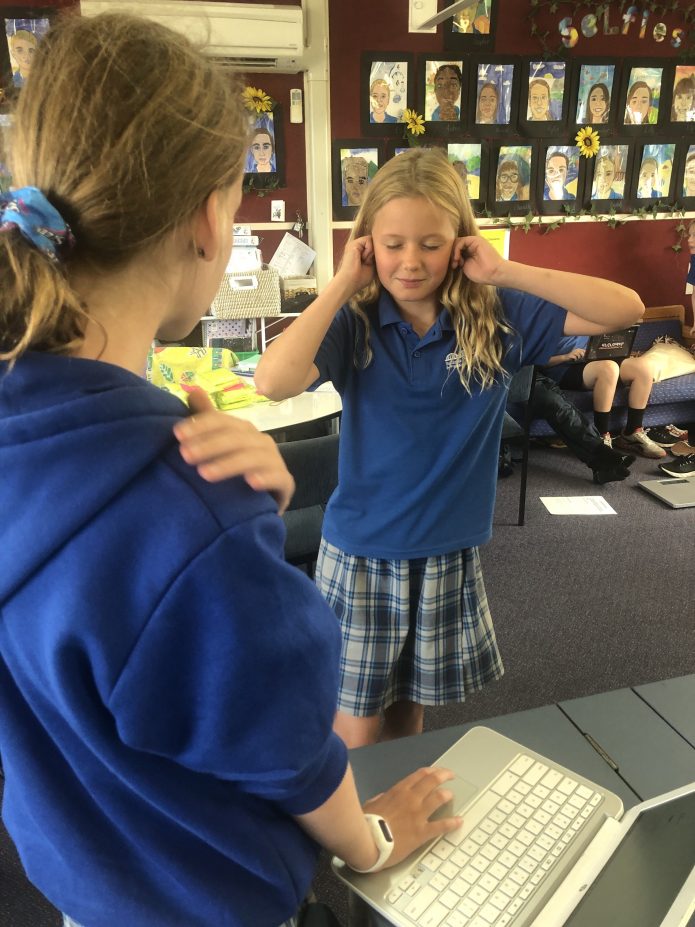
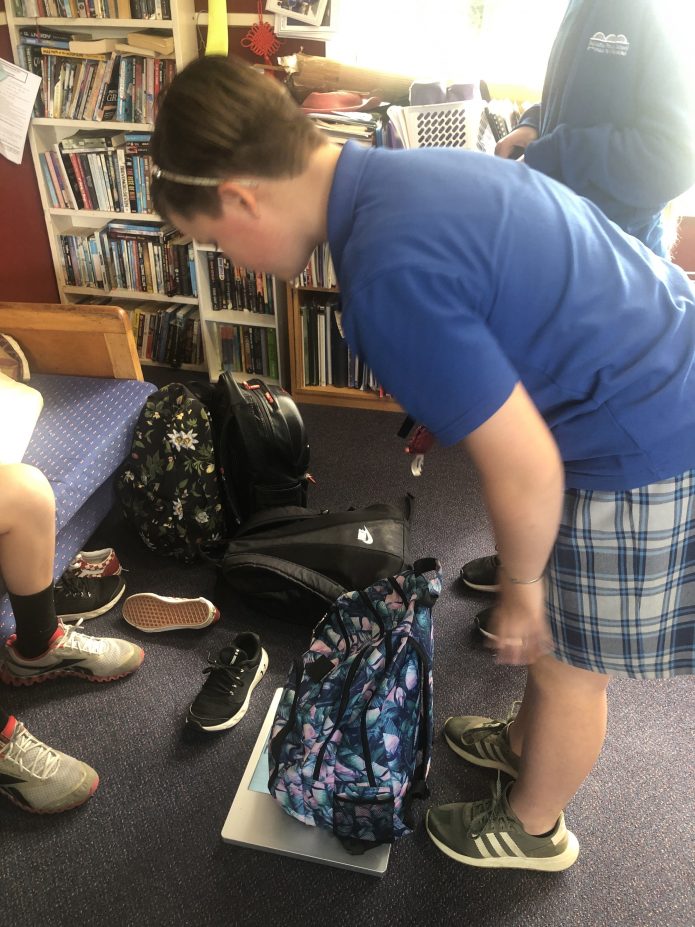
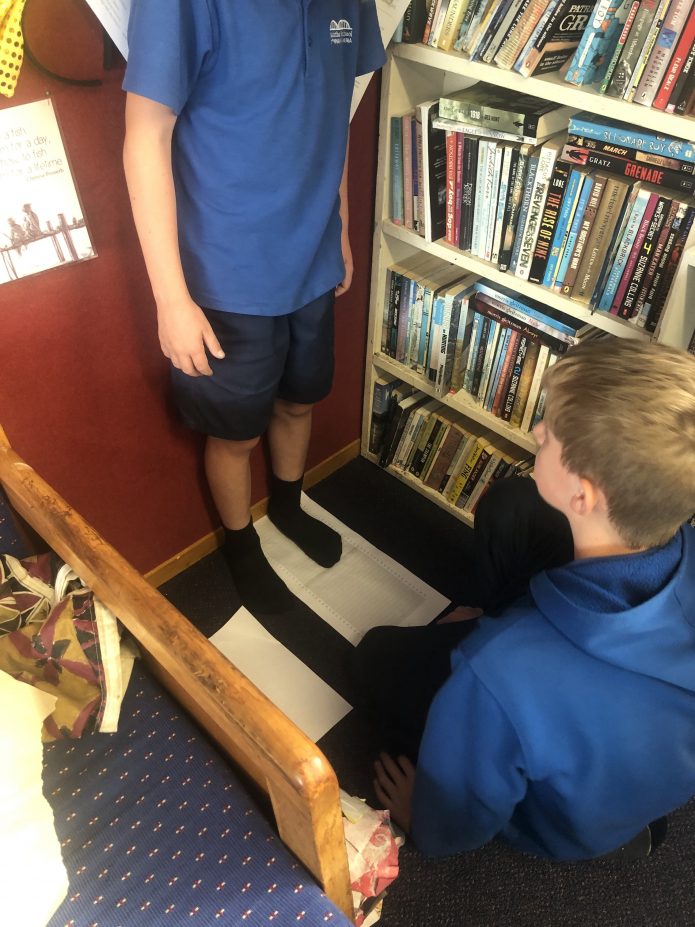
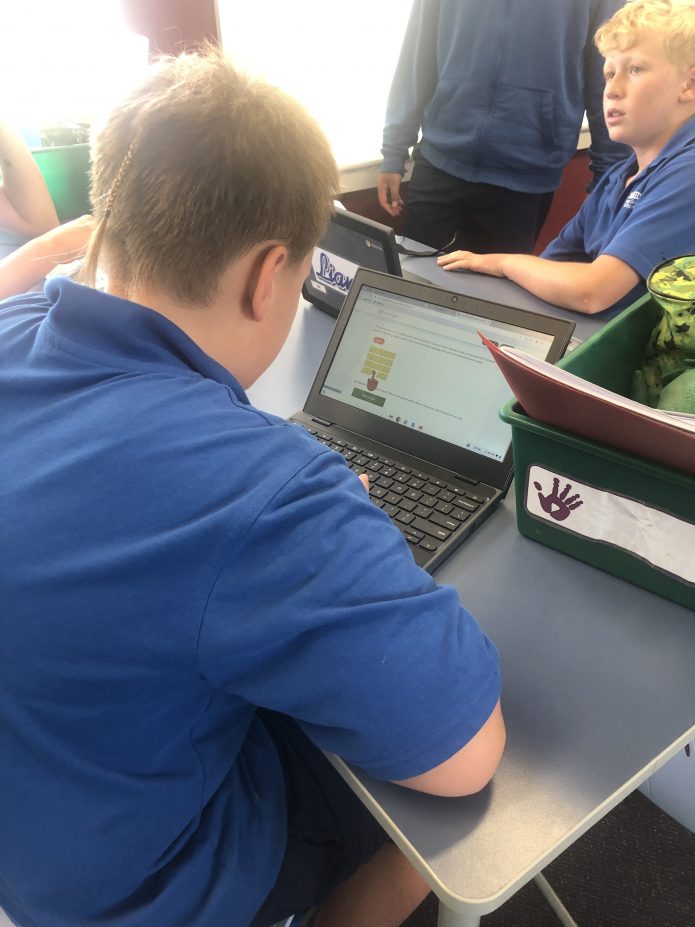
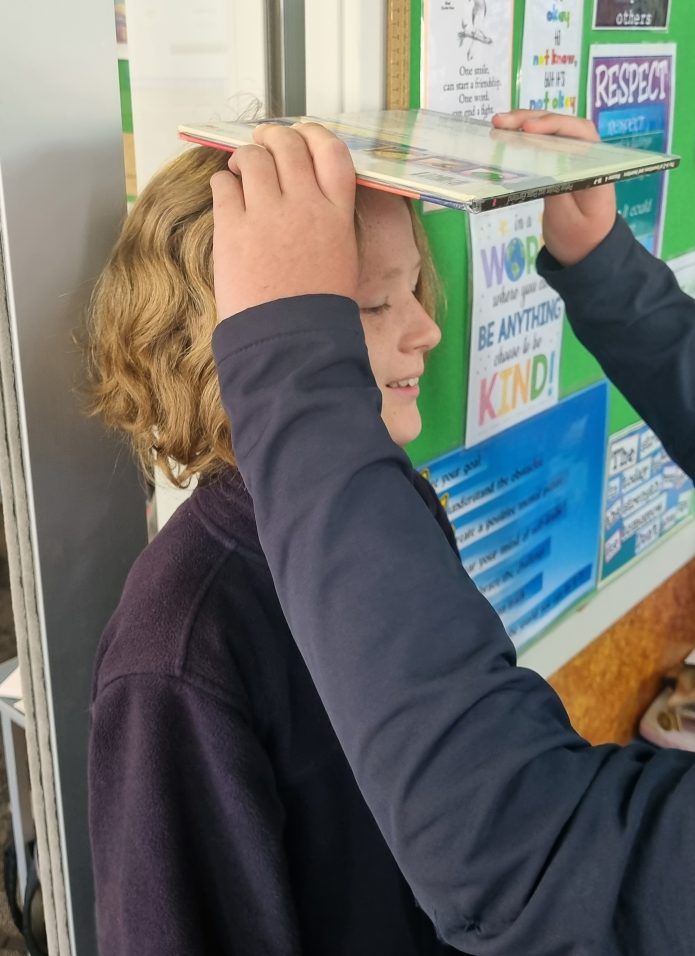
Supervised by teachers, students from years 3-13 anonymously answer questions in English or te reo Māori on digital devices. Some questions involve practical activities such as measuring the length of their feet and weighing their laden school bags.
The eleventh biennial edition of CensusAtSchool is expected to have the highest number of schools, teachers, and students participating. More than 40,000 schoolchildren are expected to participate in CensusAtSchool this year. As of launch this morning, approximately 1,700 teachers from 900 schools had already registered.
Co-director Rachel Cunliffe says, “We’re passionate about getting real, relevant data about New Zealand students into their hands so that they can grow their data science superpower skills.”
Rachel Cunliffe, a former University of Auckland statistics lecturer who now runs a digital design company, says teachers are always looking for rich cross-curricular classroom activities.
Anne Patel, Professional Teaching Fellow and co-director says, “It’s so important that students experience every aspect of collecting and working with data, as they learn how data can be used to inform. Students are learning that data is all around us and they can “see” themselves in the data to get a real feel for patterns and variation. The experience helps students see the importance of statistics in today’s world – and they love finding out what other students are thinking and doing.”
CensusAtSchool is part of an international effort to boost statistical capability among young people.
Preview the questions and see which schools are taking part on CensusAtSchool’s website.