See the live dashboard for CensusAtSchool 2023-2024
News › 2017

Thanks to Vicki Haverkort, HOD Mathematics at Huanui College for sending these photos of Year 7 students entering their CensusAtSchool data and how they used the data to model the PPDAC cycle.

Students stood in a circle to visually see how large Tane Mahuta’s girth is at the end of the lesson.

Stats NZ – News

Stats NZ have analysed the data. View the newsletter from Stats NZ, a great resource to share with your colleagues.

Features: NZ climate change (excellent short video) and internet usage.

Sign up to receive new information releases.

Teaching Statistics MOOC Eds

The Friday Institute have opened registration for MOOCs (Massive Open Online Courses) Fall 2017.

Two of these will be of interest to teachers of Statistics, or pair up with another subject area to look for overlaps!

Teaching statistics through data investigations

Teaching statistics through inferential reasoning


Joel measuring his armspan

Liv’s height being measured

Nathaniel, Cristo and Sean attempting to stand on one leg with their eyes closed

to census

Thanks to Micheline Evans of Clyde Quay School in Wellington for sharing these photos of students taking part in CensusAtSchool.


Thanks to Heather McIntyre of Te Karaka Area School for sending these photos of students taking part in CensusAtSchool.

Anna-Marie Fergusson (The University of Auckland) presented a workshop and webinar on Statistical Reasoning with Data Cards.

“Using data cards in the teaching of statistics can be a powerful way to build students’ statistical reasoning. Important understandings related to working with multivariate data, posing statistical questions, recognizing sampling variation and thinking about models can be developed. The use of real-life data cards involves hands-on and visual-based activities.”

Anna’s work using physical data cards and digital technology supports pedagogy required to effectively teach statistical reasoning. This talk presented material from the Meeting Within a Meeting (MWM) Statistics Workshop for Mathematics and Science teachers held at JSM Chicago (2016) which can be used in classrooms to support teaching statistical thinking and reasoning, key teaching and learning ideas that underpin the activities were also discussed.

Download the webinar accompanying files

Please share this excellent resource widely with your teaching colleagues and post any feedback you have about the resources or webinar.

Thanks to Michelle Dalrymple of Cashmere High School for sharing these photos of her Year 9 class taking part in CensusAtSchool.

Our press release with insights into our students’ school lunches received a range of media coverage, including:

Press release: May 2, 2017

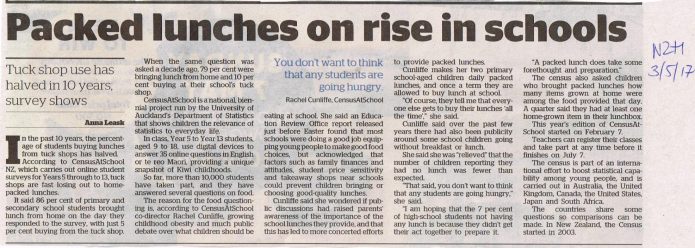
School tuck shops are losing ground to home-packed lunches, according to latest results from the long-running CensusatSchool TataurangaKiteKura. In the past 10 years, the percentage of students buying lunches from tuck shops has halved.

Overall, 86% of primary and secondary school students brought their lunch from home on the day they responded to the survey, with just 5% buying from the tuck shop. When the same question was asked a decade ago, 79% were bringing lunch from home and 10% buying at their school’s tuck shop.

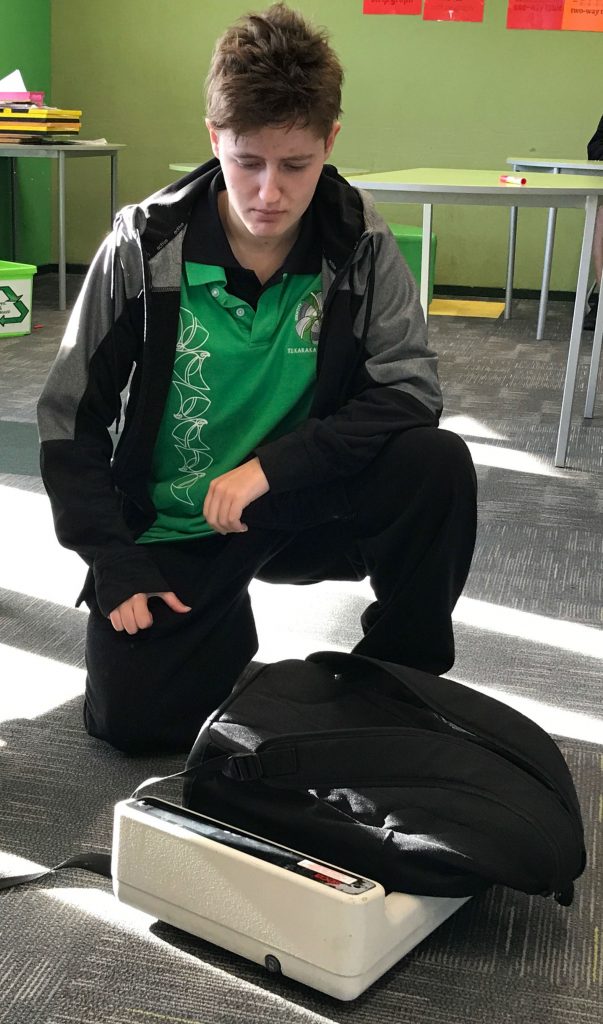
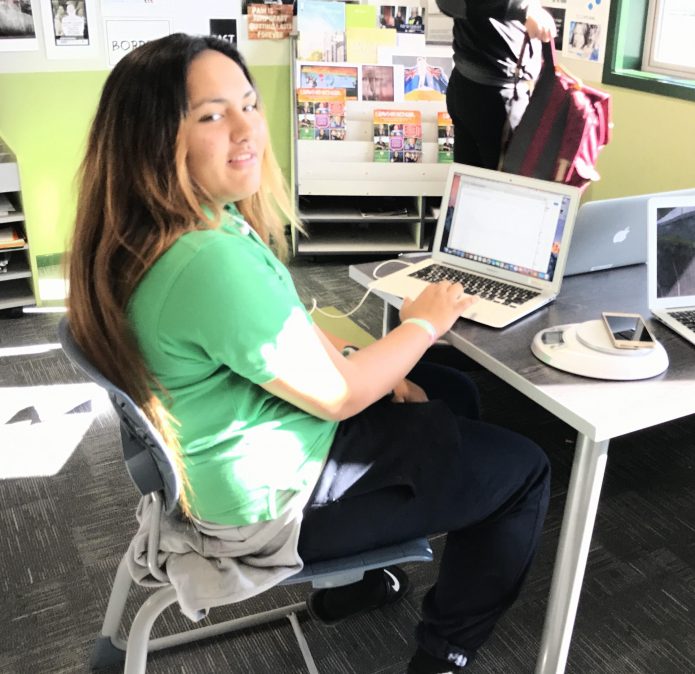
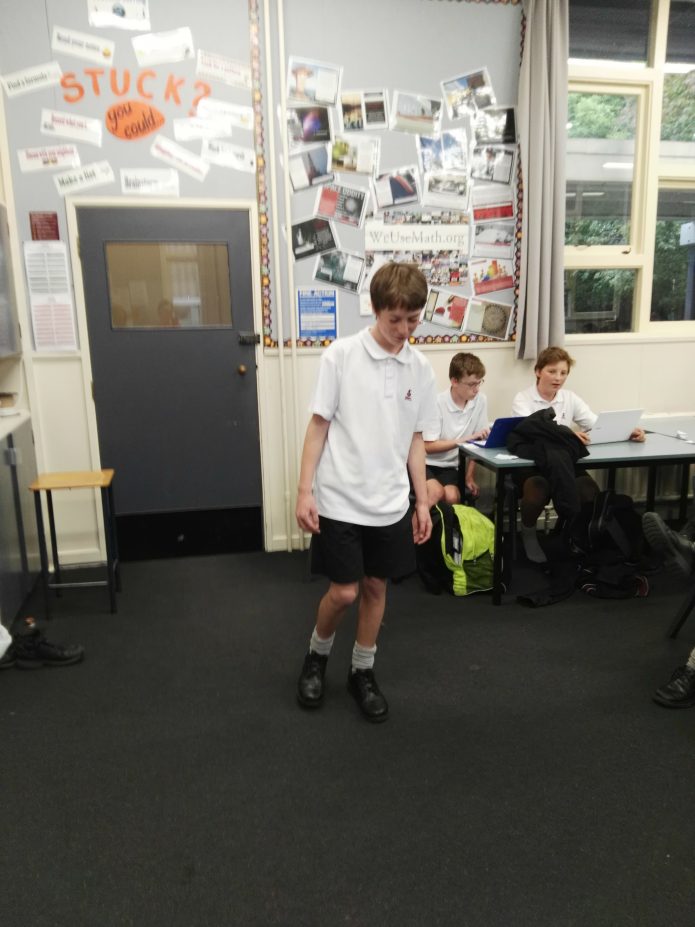
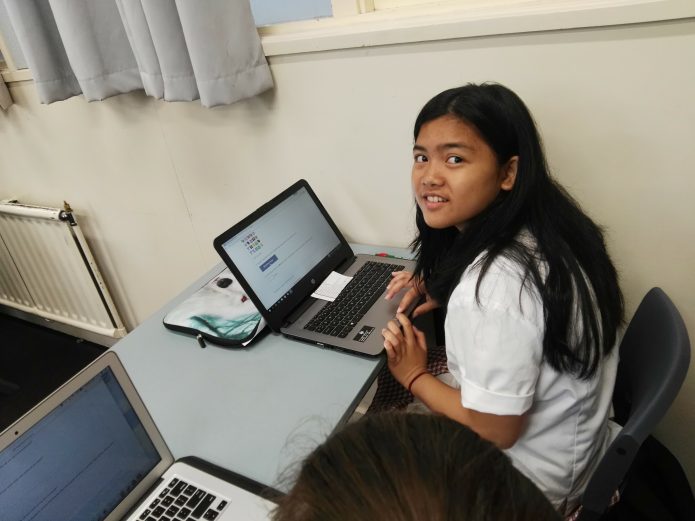
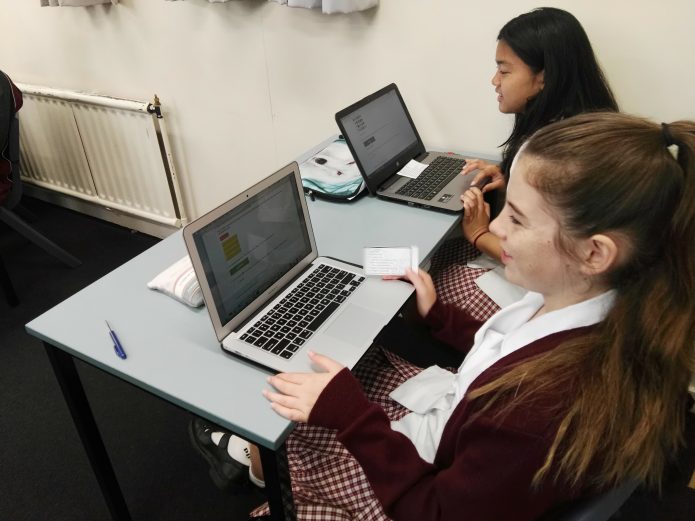
CensusAtSchool TataurangaKiTeKura is a national, biennial project run by the University of Auckland’s Department of Statistics that shows children the relevance of statistics to everyday life. In class, Year 5 to Year 13 students (aged 9 to 18) use digital devices to answer 35 online questions in English or te reo Māori, providing a unique snapshot of Kiwi childhoods. So far, more than 10,000 students have taken part, and they have answered several questions on food.

The Census asked “Where did you get your lunch from today?” with the possible answers “home” (overall 86%; primary 93%; high school 78%); “a shop on the way to school” (overall 3%; primary 2%; high school 3%); “the school shop” (overall 5%; primary 3%; high school 7%); “a friend at school” (overall 0.5%; primary 0.2%; high school 1%); “provided by my school” (overall 2%; primary 1%; high school 4%); and “don’t have any” (overall 3.6%; primary 1%; high school 7%).

The backdrop is growing childhood obesity and much public debate over what kids should be eating at school. An Education Review Office report released just before Easter found that most schools were doing a good job equipping young people to make good food choices, but acknowledged that factors such as family finances and attitudes, student price sensitivity and takeaway shops near schools could prevent children bringing or choosing good-quality lunches. Many school-run tuck shops lost money, so schools often contracted out to providers who “were profit-driven, and tended to be most interested in stocking what would sell well; not usually the healthy options”.

CensusAtSchool co-director Rachel Cunliffe, who has two school-aged children, says that she wonders if public discussions have raised parents’ awareness of the importance of the school lunches they provide, and that this has led to more concerted efforts to provide packed lunches. Mrs Cunliffe makes her two primary school-aged children daily packed lunches, and once a term they are allowed to buy lunch at school: “Of course, they tell me that everyone else gets to buy their lunches all the time.”

The past few years has also brought publicity about some school children going without breakfast or lunch, and Mrs Cunliffe says she was “relieved” that the number of children reporting that they had no lunch was fewer than expected. “That said, you don’t want to think that any students are going hungry,” she says. “I am hoping that the 7% of high-school students not having any lunch is because they didn’t get their act together to prepare it. A packed lunch does take some forethought and preparation.”

The Census also asked children who brought packed lunches how many items grown at home were among the food provided that day. A quarter said they had at least one home-grown item in their lunchbox.

This year’s edition of CensusAtSchool TataurangaKiteKura started on February 7. Teachers can register their classes and take part at any time before it finishes on July 7. The Census is part of an international effort to boost statistical capability among young people, and is carried out in Australia, the United Kingdom, Canada, the United States, Japan and South Africa.

The countries share some questions so comparisons can be made. In New Zealand, the Census started 2003, and is run by the University of Auckland’s Department of Statistics with support from Statistics NZ and the Ministry of Education.

Dear Awesome Teacher of Statistics

Have you heard of the Teaching Statistics Through Data Investigation MOOC for Educators? We continue to serve teachers from across the globe and have over 400 participants in the current session (open until June 30, 2017). Need a refresher? join us–it is still free!

Yearning for more??? Well I’d like to share a few opportunities and resources.

1. We will launch a SECOND Teaching Statistics course Fall 2017!  This course is a follow-up to TSDI and specifically focuses on Teaching Statistics Through Inferential Reasoning.  See the course description and outline here. If you have a favorite task, or online app, or video or other resource that helps you teach students to reason about using data and statistical ideas to make generalizations (informally or formally) beyond the data, we would love to feature some of your ideas in the new course (credited to you of course!)!  Please complete this brief form and upload (or provide links to) your favorite resources.

2. Learn about our new initiative for being a Hub for Innovation and Research in Statistics Education [http://hirise.fi.ncsu.edu/] and join our Facebook community so we can stay connected. https://www.facebook.com/groups/hirise.fi/

3. If you have not seen the Stats4Stem website, check it out!  It is a fantastic website full of resources for statistics teachers and their students to assist with teaching, learning, and assessment in statistics. http://www.stats4stem.org/

4. Want a free online tool for exploratory data analysis! Check out the ever-improving CODAP tool at http://codap.concord.org/

5. If you are interested in pursuing a graduate degree in statistics or mathematics education at NC State, check out  our PhD and Masters degrees! Not able to move to Raleigh?? Then consider the 12 credit (4 classes) online graduate certificate in Statistics Education! I’d love to continue learning with you!

Thank you for your continued commitment to making the world a better place through statistics and data literacy. Together we make a difference.

Many Smiles,

Hollylynne Lee

Professor, Mathematics and Statistics Education
University Faculty Scholar
Department of Science, Technology, Engineering, and Mathematics Education
Faculty Fellow, Friday Institute for Educational Innovation
NC State University