See our live dashboard
News › Announcements

New Zealand Election Statistical Resources

With the New Zealand election approaching, have you seen or created any related statistical resources? Let us know!

Vote for Bird of the Year

This year’s competition is now open! Vote for your favourite bird before 5 pm on Sunday 20 September. Vote now.

Reminder: Call for Presenters: Statistics Teachers’ Day 2026

The University of Auckland and AMA Statistics Teachers’ Day annual PD day relies on inspiring teachers showcasing the excellent work happening in their schools. Visit the website to learn more and submit your presentation idea.

Ihaka Lecture Series – University of Auckland

Catch up on the three recent lectures centred around the theme, Thinking Critically, Creatively, and Responsibly with Data. Watch the lectures.

Upcoming Dates

  • Term 3: CensusAtSchool remains open – Get started
  • November 7: AMAonline
  • November 27: Statistics Teachers Day
  • November 30: Current CensusAtSchool questionnaire closes

We are excited to announce that the website for Statistics Teachers’ Day 2026 is now live! This year’s theme is Who? What? Where? How?

Please help us spread the word by sharing the website link across your professional networks, department chats, and school channels:

Call for Presenters

The University of Auckland and AMA Statistics Teachers’ Day annual PD day relies on inspiring teachers stepping up to showcase the excellent work happening in their classrooms, departments, and schools.

They are looking for a diverse range of workshops focused on:

  • Phases 4 and 5 implementation
  • New NCEA standards and course designs
  • Practical subject insights and classroom strategies

Flexible Presentation Formats

Workshops don’t need to be long or daunting! Flexible presentation lengths are offeredto suit what you want to share:

  • Short Lightning Sessions (10 mins): Perfect to share “just one thing” or a single activity you are trying out with your students.
  • Full Workshops (up to 90 mins): Great for deep dives into unit designs, resource sharing, or interactive activities.

Head over to the website today to register your presentation idea and join the lineup!

Help Statistics Education Researchers Out

Statistics Education researchers from the University of Porto and the Polytechnic Institute of Beja, in Portugal, want to better understand how secondary and tertiary statistics teachers use technology for teaching and learning statistics and data science in different parts of the world. They have developed a survey that aims to identify and gather information on the use of technological and programming tools that reinforce computational thinking practices in the teaching and learning of statistics and data science.

We have been asked to share this survey with teachers in Aotearoa New Zealand. Please help them out by filling in the survey below: https://inqueritos.ipbeja.pt/index.php/486993?lang=en

Upcoming Dates


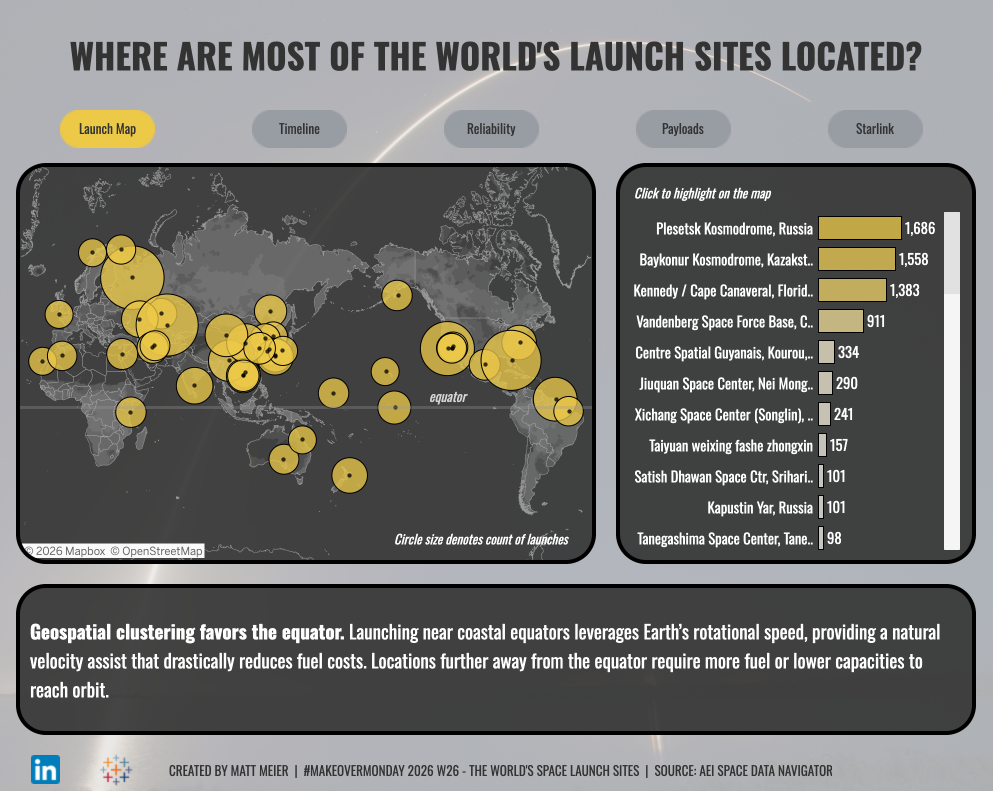
Have you seen the dataset and visualisation website Makeover Monday? It’s designed for people to take a dataset and create a data visualisation. However, there are over 400 datasets and 1,500+ cool data visualisations that have been made by others, such as where the space launch sites are in the world:

Generation AI: A Finnish approach to K-9 AI education 

Available until 31 August, it’s your last chance to watch this recorded IASE webinar.

Artificial intelligence is rapidly becoming part of everyday life, yet most educational discussions focus on using AI tools rather than understanding how AI systems work. This talk introduces the Finnish Generation AI research and development program, which has spent the past several years developing pedagogical models, classroom activities, and open educational technologies for AI literacy in schools.

The presentation explores how AI education can be approached as an empirical science education, where learners investigate, experiment with, and reason about AI systems rather than simply use them. Particular attention is given to the role of data, uncertainty, inference, prediction, and evaluation.

The talk showcases two classroom tools developed in the Generation AI project. Somekone is an explainable social media simulator that helps learners investigate how digital traces are collected, how profiles are constructed from behavioral data, and how recommendation systems shape information environments. Little Language Machine is an interactive learning environment that allows learners to train and inspect their own small language models, making otherwise invisible processes such as token prediction, training, loss minimization, and model evaluation visible and discussable.

Through these examples, the talk examines how we can help learners move beyond seeing AI as a black box toward understanding how data-driven systems learn from data, make predictions, and influence individuals and
societies. The session will provide both conceptual insights and practical examples for teaching about modern AI in educational settings.

Watch the talk

Upcoming Dates


Last month at ICOTS in Brisbane, Emeritus Professor Chris Wild was honoured with a Lifetime Advocacy Award. Join us in celebrating this wonderful recognition for his remarkable career that transformed how the world teaches and learns statistics. Chris has also been an integral part of CensusAtSchool since the beginning. 

Emeritus Professor Chris Wild

This lifetime advocacy award goes to a person who has changed the experience of statistics education for both teachers and their students across the Pacific and beyond. Chris Wild followed through on George Cobb’s vision of an entirely new way of learning about statistical concepts through data exploration. He did this in two ways: he created technology for teaching and learning about uncertainty in data, and then he rewrote curricula and modelled best practice in teaching simulation-based ideas about chance and data. Nowadays, every student can access and learn from data while learning statistical concepts that underpin the understanding of chance and data. In Aotearoa, we see ourselves as cutting-edge in statistics education; this is largely Chris Wild’s legacy to us, as well as breaking down barriers to learning statistics and making sure that data really is for everyone.

In 1999, with his PhD student and partner in crime, Maxine Pfannkuch, Chris co-authored a seminal paper on empirical inquiry that laid out how statistical thinking and reasoning differ from mathematical reasoning and how this difference affects the broader process of scientific inference. But Chris wasn’t content with researching how statisticians work and reason; he wanted to change classroom practice and rescue students from context-free mathematical formulas. So he did what all great statisticians do: he created tools for others to explore and work with their own data. He created iNZight, a free, open-source platform that allows students and their teachers to create plots of multivariate data instantly. Most of you will remember spending hours laboriously drawing graphs by hand. Now, students can watch dot and box plots appear with a simple click; they can see how data behaves and feel variation without drowning in squared paper, rulers, and equations. We have come a long way. 

Chris also built Visual Inference Tools, allowing students to literally see the theory of confidence intervals and hypothesis tests unfolding. He was involved in the team that gave us Pachinkogram for conditional probability and Scampy for conceptual reasoning. You may not be aware that the ‘C’ in Scampy stands for Chris. Why not sneak your name into a statistics tool? Chris’s tools have helped so many students and mathematics teachers learn statistical concepts. 

Chris was there at the beginning of the International CensusAtSchool project, and he got hundreds of thousands of kids around the Pacific arguing over high-stakes statistical questions, such as: ‘Does pineapple really belong on pizza?’ CensusAtSchool has been running for over twenty years and is a powerful platform that connects educators across educational divides, from primary to tertiary education. It serves as a one-stop shop for teaching and learning statistics.

At the turn of the millennium, Chris realised that reaching teachers and access to technology were barriers to young people working and exploring data in their classrooms. So, Chris and Maxine organised a classic Kiwi road trip, taking iNZight and a new world-leading curriculum to small towns across Aotearoa. Suddenly, statistics moved from being taught after the exam to being the first topic taught in classrooms around the Pacific. Teachers and their students could see it was a living, human process, and they found themselves noticing and wondering about things they couldn’t before Chris’s technology supported them to do so. 

Chris has led global stats education through IASE, the ISI, and ISLP, always championing what he calls ‘computational skills by stealth.’ His YouTube channel, WildAboutStatistics, has clocked over 1.5 million views. Today, in between grandfather duties, he’s tackling Generative AI, warning us to ‘walk backwards into the future’ so we don’t lose our core reasoning.

Over his teaching career, Chris Wild didn’t just model best practice in statistical thinking and reasoning; he helped democratise data science. He helped realise what George Cobb dreamed about and shifted the global paradigm in statistics education from mathematical gatekeeping to visual intuition. Please join us in celebrating Emeritus Professor Chris Wild, who proved that we should all be just a bit “Wild” about statistics!

We’re delighted to celebrate University of Auckland statisticians Professor Thomas Lumley, Associate Professor Simon Urbanek, and Associate Professor Paul Murrell, who have won a top global award intended to be a Nobel Prize for statisticians for their work on the ‘R’ programming language.

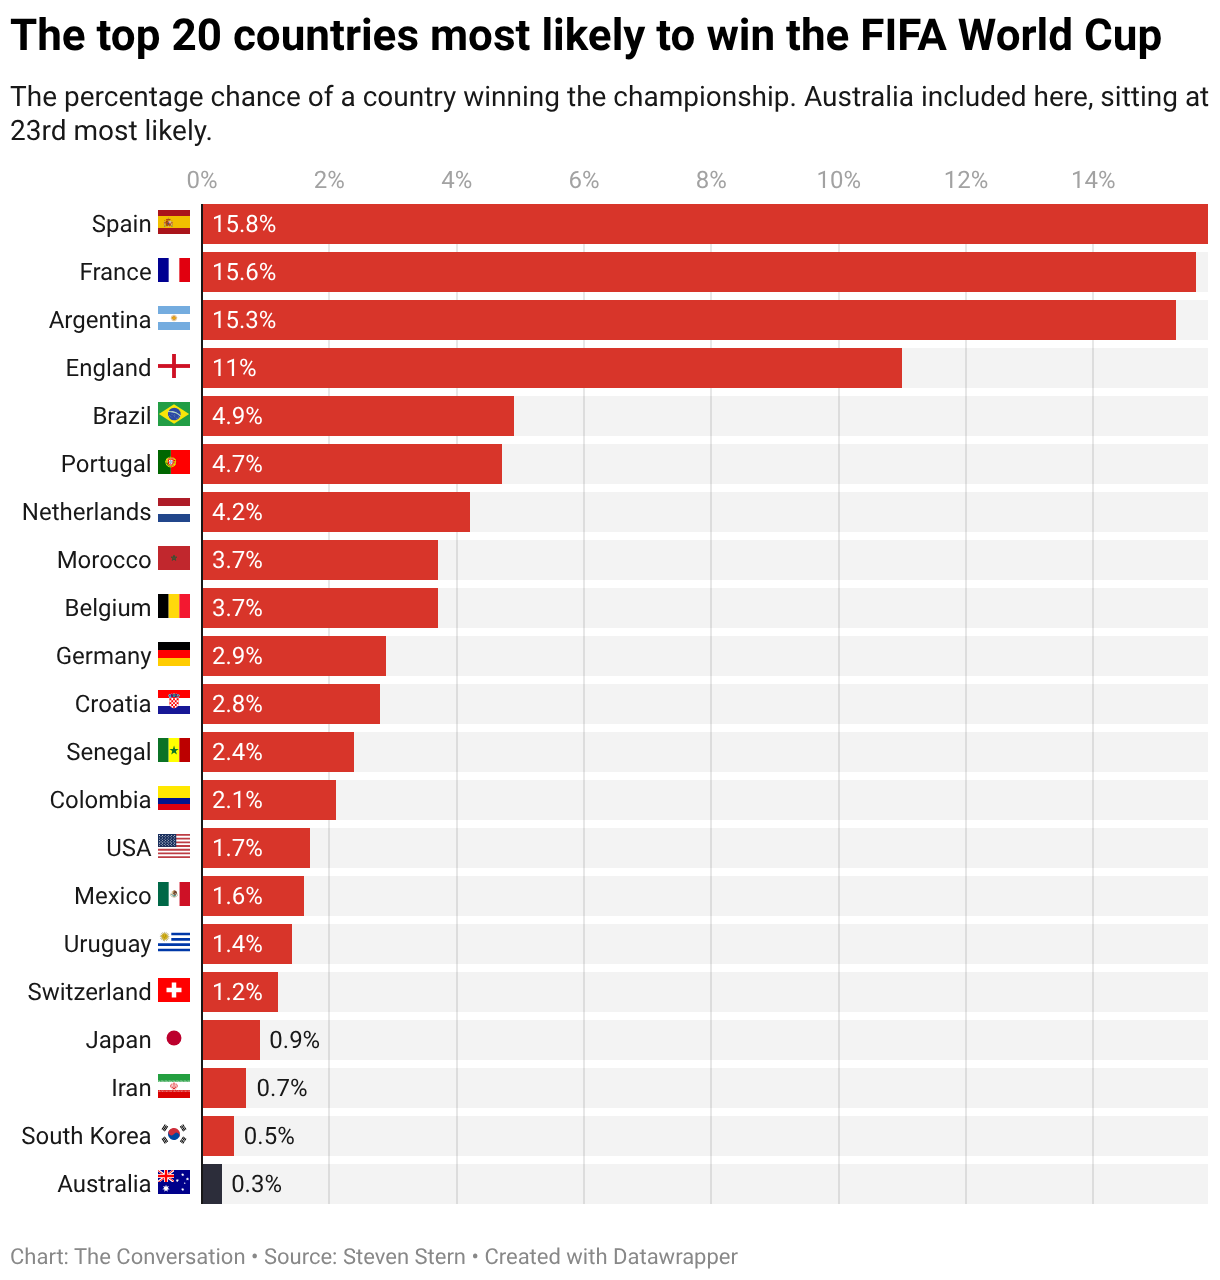
Data scientist Steven Stern has built a FIFA World Cup simulation to predict the results of every game. The statistical modelling is explained, along with the predicted results based on one million simulations. He predicts the winner will most likely be Spain.

(Let’s ignore the All White predictions….)

Data Cards

In case you missed it last week, we have created a set of All White data cards for your classroom.

These cards are a fantastic, real-world resource for data literacy. The data has been sourced from NZ Football, Friends of Football NZ, ESPN, and Instagram, and we have left a space for students to draw or paste an image of each player.

Dot Plots

This new PLD resource from Pip Arnold covers the different ways of teaching dot plots to students using the EIS-T model.


Kia ora koutou,

We’re starting work on next year’s CensusAtSchool questionnaire and would love your help to keep it relevant and engaging.

There is no fixed commitment. You can contribute as much or as little as you like, from a five-minute review to trialing a draft survey with your class.

If you’re interested in helping shape the survey, please contact us to let us know. 

As covered in our Behind the Questions Guide, this process includes:

  • Deciding which questions to keep, update, or remove.
  • Sifting through student-submitted questions from the current survey.
  • Proposing new questions and testing them with students.
  • Checking survey length, Māori translation, technical functionality, and external review by the Ministry of Education, Stats NZ, and Stats NZ’s questionnaire design team.

We look for questions that are:

  • Engaging, positive, relevant, easy for young students to understand and answer, and engaging for students.
  • Suitable for a variety of data analysis activities and time-series comparisons.
  • Covering well-being, lifestyle, interests, and opinions, and avoiding illegal or unsafe behaviours.
  • Also asked by Stats NZ in official data surveys and international CensusAtSchool partners.


Do you use iNZight Lite, or do you want to learn how to use it? 

iNZight Lite is a free, browser-based tool to help high school students analyse data. Students can import their own dataset or explore built-in examples, using visualisation, transformation, and statistical analysis.

We’ve put together a guide for teachers with tutorials to get started, plus exercises and videos.

Have you seen our Year 9 Summary Investigations Teaching Sequence?

This is a suggested set of 12 lessons with a focus on the students collecting data about themselves. The materials were developed in conjunction with and trialled by Auckland Girls’ Grammar School, Lynfield College, and Northcote College mathematics and statistics departments.

Probability Resources for Year 4–6

See seven resources on our website, including the Great Coin Toss Challenge, Lucky Seven Dice Rolling, and the Last One Standing Game.

FIFA World Cup

Kicking off in less than a month on 11 June, the tournament features the All Whites making their third-ever appearance. New Zealand plays its opening match on 16 June, marking their first qualification for FIFA since 2010.

If you make data cards or other activities, or see any good resources for statistics classrooms, please let us know!


Tomorrow is World Stationery Day. Here are some ideas for how to incorporate this into your classroom:

Pen vs. Pencil

“Do Year [X] students write more words per minute with a pen or a pencil?”

Have half your class start with a pencil and the other half with a pen for a 1-minute writing sprint, then swap. It’s a fantastic way to discuss measurement error, reproducibility, and individual variability.

Gel Pen vs. Ballpoint Pen

2025 study in the American Journal of Human Psychology showed that gel pens significantly outperformed ballpoint pens in both writing speed and total word count. This study provides an excellent real-world context for teaching concepts such as paired t-tests and the Wilcoxon Rank Test, and the distinction between statistical significance and practical effect size.

Earth Day

Tomorrow (April 22) is Earth Day. Here are some ideas for how to incorporate this into your classroom:

  • What sorts of insects are common in the grass areas of our school? Survey Your Environment – PPDAC cycle (Years 1–3)
  • How are students’ travel methods to school changing over time? We have the data going back to 2005! Interestingly, car usage has remained flat at 40%. The real shift is happening elsewhere: walking has dropped from 26% to 21%, while bus usage has grown from 23% to 28%. You could also explore travel time to school.
  • How are students’ opinions about climate change/global warming changing over time? Explore CensusAtSchool data. We have the data going back to 2005!