|
||||||||||||||||
|
||||||||||||||||
|


Last week the University of California sent a momentous email to 20,000 high schools announcing that they would now accept data science as an alternative to algebra 2 – this has huge implications for schools & students. Read the full announcement
The ZDM special issue on Innovations in statistical modelling to connect data, chance and context is now freely available (open access) during October.
It would be great, if you could distribute the news via your networks.
https://www.springer.com/journal/11858/updates/18235366
Published 9 September 2020
Royal Society Te Apārangi remembers celebrated mathematician Sir Vaughan Jones

It is with sadness we share news of the passing of Sir Vaughan Jones FRS Hon FRSNZ, aged 67, from the complications from an ear infection. Sir Jones will be remembered as a brilliant mathematician who made outstanding contributions to the field of mathematics, scientific research and higher education.
Sir Vaughan Jones was born and raised in New Zealand and went to the University of Auckland, graduating in 1973.
He moved overseas to earn his doctorate from the University of Geneva, and became a Professor of Mathematics at the University of California at Berkeley in 1985.
Despite his career overseas, Sir Vaughan worked hard to promote mathematics of the highest quality in Aotearoa. He has made key contributions to scientific research and post graduate education here in New Zealand and across the globe.
He is best known for the discovery of an unexpected link between the mathematical study of knots – a field dating back to the 19th century – and statistical mechanics, a form of mathematics used to study complex systems with large numbers of components. He found a new polynomial invariant for knots and links in three-dimensional space – something that had been missed by topologists during the preceding 60 years.
His discovery of what is now called the Jones polynomial had origins in the theory of von Neumann algebras. Friend and long-time colleague of Sir Vaughan, Distinguished Professor Marston Conder FRSNZ told the NZ Herald that his work has had a wide application.
“[His] work in theoretical mathematics, which basically helps distinguish one knot from another, had application in biological science, enabling scientists to identify whether two different types of RNA are from the same source,” Marston said.
“That was an outstanding achievement because from theoretical mathematics, his discoveries had real significance in an entirely different field.”
Because of this work, Sir Vaughan became the first ever winner from the Southern Hemisphere of the Fields Medal in 1990, which is widely regarded as the “Nobel Prize of Mathematics” because of the prestige it carries. He famously accepted the award in an All Blacks rugby jersey. He remains the only New Zealander to have won the Fields Medal.
In 1991, Sir Vaughan was the first winner of the Society’s prestigious Rutherford Medal. In 2012 the Society established the Jones Medal in his honour, for lifetime achievement in pure or applied mathematics or statistics.
Sir Vaughan was elected as a Fellow of The Royal Society, London in 1990 and elected as an Honorary Fellow of the Royal Society of New Zealand in 1991. In 2002 he was made a Distinguished Companion of the New Zealand Order of Merit (DCNZM) (later re-designated Knight Companion KNZM).
Our deepest condolences go out to the whānau and friends of Sir Vaughan – he has left a prominent mark on the academic community, one that will not be forgotten.
Sir Vaughan is survived by his wife, Martha Jones, and three children.
Source: Royal Society Te Apārangi
Awash in Data, is a free open-source e-book authored by the fabulous Tim Erickson. Designed for both teachers and students, this rich, interactive resource walks users through introductory lessons in data science with CODAP (Common Online Data Analysis Platform). Embedded CODAP documents bring each lesson to life. Give it a go!
Dr Michelle Dalrymple, Mathematics and Statistics Faculty Head at Cashmere High School in Christchurch, is the 2019 Prime Minister’s Science Teacher Winner.
Michelle’s teaching stands out because it is strongly based on cutting-edge mathematics and statistics education research, while maintaining originality, creativity, and fun with strategies that are relevant and inspiring for her students. Read more…
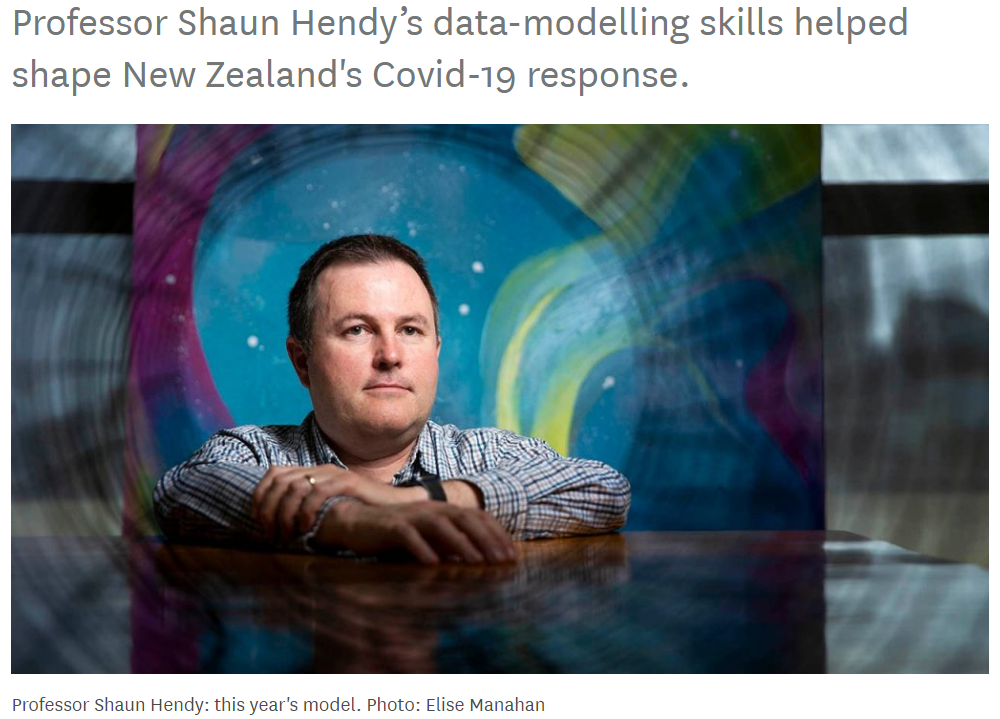
An article about the people behind the scenes of Aotearoa’s response to the Covid-19 pandemic.
Shaun Hendy shares his experiences providing model-based data and recommendations to the government.
Maths Week 2020 is being held between 10 August and Friday 14 August.
Maths Week provides resources for students and teachers. The material Maths Week is written for all students from Year 1 through to Year 11 at different levels:
- Level 1 – primarily for Years 1 and 2.
- Level 2 – primarily for Years 3 and 4.
- Level 3 – primarily for Years 5 and 6.
- Level 4 – primarily for Years 7 and 8.
- Level 5 – primarily for Years 9, 10 and 11.
One of the Maths Week series (Maths Millionaire) has also been translated into te reo Māori.
Teachers who register for Maths Week have access to answers to questions and other notes.
Maths Week resources are available free, on-line, to teachers, parents and students.
For teachers to register themselves and their class numbers, go to www.mathsweek.co.nz/
Maths Week 2020 will be on from Monday 10 August until Friday 14 August.
Last year there were 288 441 students and 6657 teachers registered throughout New Zealand. This is an increase of 5594 students and 543 teachers from 2018.
Maths Week is written for all students from Year 1 through to Year 11.
It is available free, on-line, to teachers, parents and students.
Maths Week material is written:
- to encourage students’ interest in mathematics and statistics
- to give teachers resources that they can use in the classroom, particularly material that requires some research and which may not be readily available to them, or that can be used electronically in class
- to show the pleasure that mathematics can provide and some of the everyday places where it can be used
- to give teachers material that can provide extension.
Maths Week has five levels:
- Level 1 – primarily for Years 1 and 2.
- Level 2 – primarily for Years 3 and 4.
- Level 3 – primarily for Years 5 and 6.
- Level 4 – primarily for Years 7 and 8.
- Level 5 – primarily for Years 9, 10 and 11.
This year, the Maths Week sections are similar to those of 2019.
- Survivor series. A series of in-class tasks at levels 1 – 5 for each day during Maths Week. Each day’s tasks has a theme (the same theme for all levels).
- Maths Millionaire. Maths questions, with junior (Years 5 and 6), middle (Years 7 and 8), senior (Years 9 – 11) and family divisions.
- The Maths Chaser. Maths questions at each of levels 2 – 5.
- Daily Dollar. Maths activities at each of levels 1 – 5.
- Dollars and cents. Questions to encourage financial capability (primarily for Years 9 – 11) for each day during Maths Week. Each day’s questions has a theme.
- Super Challenge. One mathematical challenge each day for four days. Those who answer all four correctly can get a certificate.
- Some Maths Matters. Five chapters on various mathematical topics.
- Two interactive games.
Maths Millionaire and the games are easily accessed by students on their tablets or phones.
Teachers who register for Maths Week have access to answers to questions and other notes.
For teachers to register themselves and their class numbers, go to https://www.mathsweek.co.nz/
What’s the superpower every student needs? Statistics, of course.
Dr. Samuel Echevarria-Cruz, Dean of Liberal Arts, Social and Behavioral Sciences at Austin Community College, and Rob Santos, Vice President and Chief Methodologist at The Urban Institute, led a discussion about how statistics—the science of learning from data—is the new superpower every student needs in their studies and career.
Statistics influences industries as varied as sports, fashion, public health, and more, and continues to increase in its importance and opportunities. In fact, statistician was named the #1 Best Business Job and #6 among the top 100 Best Jobs by U.S. News & World Report.
Now more than ever, it’s a great time to take a statistics class and prepare yourself for a bright future.