See the live dashboard for CensusAtSchool 2023-2024
News › 2013

Secondary school students from around the world are eligible to enter into the International Year of Statistics (Statistics2013) photo contest.  

Students are to send in a photo which they have taken themselves of something which effectively illustrates the impact of statistics, along with a title and description.

Entries must be received by November 1 and winners will be announced in the middle of December.

The grand prize is $800US, with a further three prizes of $350US, $200US and $150US per continent.

Learn more

How about getting a Stats project running with your classes in the build up to Christmas!

The International Year of Statistics (Statistics2013) is a worldwide celebration and recognition of the contributions of statistical science.

Through the combined energies of organizations worldwide, Statistics2013 will promote the importance of statistics to the broader scientific community, business and government data users, the media, policy makers, employers, students, and the general public.

The goals of Statistics2013 include:

  • Increasing public awareness of the power and impact of Statistics on all aspects of society.
  • Nurturing Statistics as a profession, especially among young people.
  • Promoting creativity and development in the sciences of Probability and Statistics.

Learn more »

Statistics quiz

Stats2013AtSchool is a worldwide school project connected to CensusAtSchool. It includes a 12-question quiz on statistics that your students can take part in right now.

This might make for a great classroom activity before the end of the school year.


The team would also love teachers to contribute questions for future use in the quiz.  

A welcome and a farewell

We recently welcomed Anne Patel, who last taught at Waiheke High School, to the CensusAtSchool New Zealand team. Anne is continuing the great work that fellow teacher Tracey Meek started with the organising of classroom resources on our new CensusAtSchool website. Tracey was on the team for just over a year and we will miss her fantastic input.

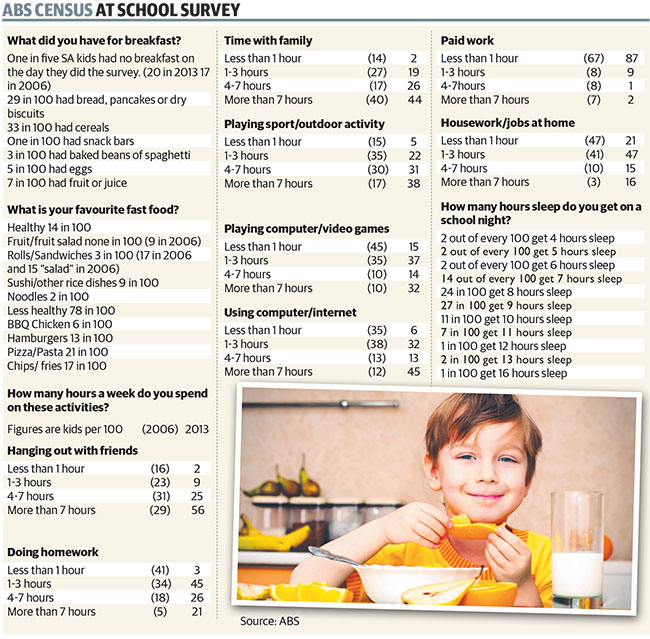
“THE average Aussie student starts the day with cereal, travels by car to school and relaxes by spending time online; gaming if they are boys and social networking for girls.

A new Census at School snapshot from the Australian Bureau of Statistics also shows their favourite takeaway food is pizza or pasta (21.5 per cent), followed by hot chips (15.3 per cent).

They are more worried about stopping bullying than any other social issue, followed by having healthy habits, access to the internet and conserving water.

Environmental consciousness is high for the 21,617 students surveyed, with 86.9 per cent turning off the tap when they brush their teeth, more than 80 per cent of households recycling and more than half having shorter showers to save water and or turning off appliances to save power when not in use.”

Continue reading »

More results are out from CensusAtSchool Australia:

The CensusAtSchool survey findings, released yesterday by the Australian Bureau of Statistics, show 22.3 per cent of [Australian] Territory kids are missing the most important meal of the day.

The survey was made up of voluntary responses from more than 23,700 Australian school children.

The second worst in the country was the ACT (20.1 per cent not eating breakfast) and Tasmania (18.5 per cent).

In Victoria, the best performing state, only 12.3 per cent of kids missed breakfast.

Continue reading »

Australian CensusAtSchool have just released results from their latest survey:

Australian students say school bullying is the most important social issue to tackle, according to the latest Australian Bureau of Statistics data.

Bullying at school has been the highest rated social issue, across Australia over the last four years, ABS assistant director of education services unit Frances Mawdsley said.

“Reducing bullying has been the social issue of highest importance to Australian students since 2010, with a peak level of importance recorded in 2012,” she said.

“It has actually reduced across Australia in 2013, but still remains as the number on issue.”

Students rated the importance of reducing bullying in the survey, a median of 84 out of 100, Ms Mawdsley said.

West Australian students had rated the importance 80.4 out of 100.

The figures indicate that bullying causes a great deal of anxiety among children, ECU Child Health Promotion Research Centre Professor Donna Cross said.

Continue reading »

USDA’s National Agricultural Statistics Service (NASS) and the American Statistical Association (ASA) have developed a new Census at School Food Preference Survey lesson plan and activities for students in grades 5-8.  Building on the existing ASA Census at School program, the Food Preference Survey teaches statistical and agricultural literacy to children through common core state standards in Mathematics, Language Arts, Nutrition, Social Studies, and Family Consumer Sciences.

“Increasing statistical literacy in youth is an important way to develop the next generation of statisticians,” said NASS Administrator Dr. Cynthia Clark.  “The Census at School program is a way to make statistics fun and engaging for students, allowing them to compare information about themselves with that of other students in the United States and other countries.”

Students complete an online survey and submit the data to a national database. Statistical methods and concepts are then used to compare class results with random samples from peers in the United States and other countries.  Students will learn about statistics, nutrition, and cultural differences; apply graphing, mathematics, and analysis skills to real-world examples; and justify their analysis of data.

The Food Preference Survey, using three questions from the full Census questionnaire, asks students about their favorite food and beverages. The activities use the data to analyze survey results and discuss whether the results surprise the class; which foods are most popular; whether certain beverages are more popular with girls or boys; whether and how the cafeteria could use the data to plan events and meals; if there is a relationship between favorite foods and whether someone is a vegetarian; and much more. The Food Preference Survey focuses specifically on information that could be useful to agriculture-in-the-classroom teachers, as well as other teachers of the common core standards addressed.

This lesson plan was developed by the National Agricultural Statistics Service (NASS), the American Statistical Association (ASA), with guidance from the National Agriculture in the Classroom organization (www.agclassroom.org). For more information about the Food Preference Survey please visit www.nass.usda.gov/Education_and_Outreach.

Updated data tools

Accompanying today’s release of the 2013 data we have updated CensusAtSchool’s data tools to have the same simple, clean look and feel that we introduced for the rest of the site late last year.

For data-viewer and table-maker the changes the user experiences are purely cosmetic. The way in which settings are chosen in random-sampler has changed and now provides some control of sample sizes from subpopulations.

All data tools now have a prominent “Help” button near the top of the page.

Use the data tools »