Maths Week registrations are open! Check their website for resources, information, and to see what’s new before Maths Week kicks off on August 10.
The 20th annual New Zealand Garden Bird Survey kicks off this Saturday, 27 June, and runs until Sunday, 5 July. It’s a fantastic opportunity for your students to head outside for an hour, connect with nature, and contribute to an important real-world scientific dataset.
The website provides everything you need: a tally sheet, bird-identification resources, and a form to submit data. They’ve also just released the data from the 2025 survey.
We’re delighted to celebrate University of Auckland statisticians Professor Thomas Lumley, Associate Professor Simon Urbanek, and Associate Professor Paul Murrell, who have won a top global award intended to be a Nobel Prize for statisticians for their work on the ‘R’ programming language.
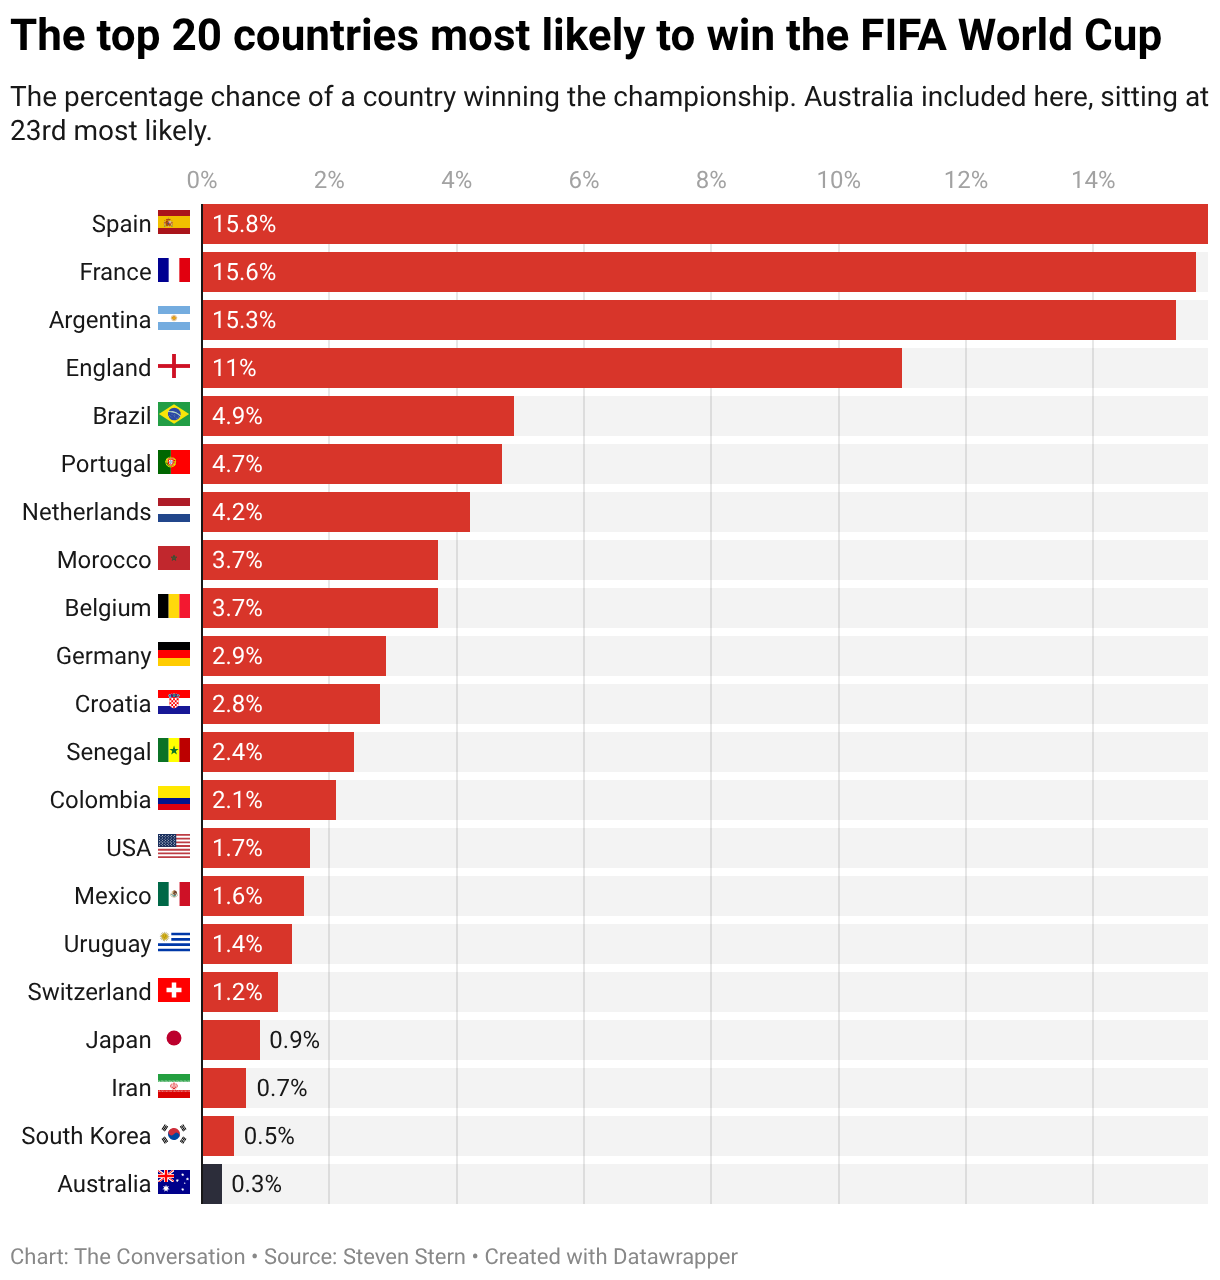
Data scientist Steven Stern has built a FIFA World Cup simulation to predict the results of every game. The statistical modelling is explained, along with the predicted results based on one million simulations. He predicts the winner will most likely be Spain.
(Let’s ignore the All White predictions….)
Data Cards
In case you missed it last week, we have created a set of All White data cards for your classroom.
These cards are a fantastic, real-world resource for data literacy. The data has been sourced from NZ Football, Friends of Football NZ, ESPN, and Instagram, and we have left a space for students to draw or paste an image of each player.
Dot Plots
This new PLD resource from Pip Arnold covers the different ways of teaching dot plots to students using the EIS-T model.
The International Association for Statistical Education (IASE) is running a free webinar on June 10 at 10 PM for teachers of Year 1–9 students on how Finland is approaching AI education and literacy through its six-year national strategic research program. Register here
Kia ora koutou,
We’re starting work on next year’s CensusAtSchool questionnaire and would love your help to keep it relevant and engaging.
There is no fixed commitment. You can contribute as much or as little as you like, from a five-minute review to trialing a draft survey with your class.
If you’re interested in helping shape the survey, please contact us to let us know.
As covered in our Behind the Questions Guide, this process includes:
- Deciding which questions to keep, update, or remove.
- Sifting through student-submitted questions from the current survey.
- Proposing new questions and testing them with students.
- Checking survey length, Māori translation, technical functionality, and external review by the Ministry of Education, Stats NZ, and Stats NZ’s questionnaire design team.
We look for questions that are:
- Engaging, positive, relevant, easy for young students to understand and answer, and engaging for students.
- Suitable for a variety of data analysis activities and time-series comparisons.
- Covering well-being, lifestyle, interests, and opinions, and avoiding illegal or unsafe behaviours.
- Also asked by Stats NZ in official data surveys and international CensusAtSchool partners.
Do you use iNZight Lite, or do you want to learn how to use it?
iNZight Lite is a free, browser-based tool to help high school students analyse data. Students can import their own dataset or explore built-in examples, using visualisation, transformation, and statistical analysis.
We’ve put together a guide for teachers with tutorials to get started, plus exercises and videos.
Have you seen our Year 9 Summary Investigations Teaching Sequence?
This is a suggested set of 12 lessons with a focus on the students collecting data about themselves. The materials were developed in conjunction with and trialled by Auckland Girls’ Grammar School, Lynfield College, and Northcote College mathematics and statistics departments.
Probability Resources for Year 4–6
See seven resources on our website, including the Great Coin Toss Challenge, Lucky Seven Dice Rolling, and the Last One Standing Game.
FIFA World Cup
Kicking off in less than a month on 11 June, the tournament features the All Whites making their third-ever appearance. New Zealand plays its opening match on 16 June, marking their first qualification for FIFA since 2010.
If you make data cards or other activities, or see any good resources for statistics classrooms, please let us know!
Tomorrow is World Stationery Day. Here are some ideas for how to incorporate this into your classroom:
Pen vs. Pencil
“Do Year [X] students write more words per minute with a pen or a pencil?”
Have half your class start with a pencil and the other half with a pen for a 1-minute writing sprint, then swap. It’s a fantastic way to discuss measurement error, reproducibility, and individual variability.
Gel Pen vs. Ballpoint Pen
A 2025 study in the American Journal of Human Psychology showed that gel pens significantly outperformed ballpoint pens in both writing speed and total word count. This study provides an excellent real-world context for teaching concepts such as paired t-tests and the Wilcoxon Rank Test, and the distinction between statistical significance and practical effect size.
Tomorrow (April 22) is Earth Day. Here are some ideas for how to incorporate this into your classroom:
- What sorts of insects are common in the grass areas of our school? Survey Your Environment – PPDAC cycle (Years 1–3)
- How are students’ travel methods to school changing over time? We have the data going back to 2005! Interestingly, car usage has remained flat at 40%. The real shift is happening elsewhere: walking has dropped from 26% to 21%, while bus usage has grown from 23% to 28%. You could also explore travel time to school.
- How are students’ opinions about climate change/global warming changing over time? Explore CensusAtSchool data. We have the data going back to 2005!
Digital tools: Harnessing technology for probability explorations and analysis Y1-11
Draft chapter by Chris Wild from Probability | Tūponotanga – A guide for teaching probability (ages 5–18). See also the related Resources.
Data Biographies
Datasets include rollercoasters, extreme heat, ladybugs, and more.
Data Education in Schools
Scottish website with lots of resources, including data selfies, data-themed escape rooms, AI literacy, and live online activities.
Data Gems
A list of datasets for use by New Zealand teachers and students, fostering statistical and mathematical thinking.
Stats Chat
Current statistics in the media, commentary, and sport match score predictions by lecturers in the Department of Statistics at The University of Auckland.