Smoking cigarettes is worse teenage behaviour than smoking marijuana, according to Year 11-13 students from New Zealand schools. Furthermore, they think that their parents would agree with them.
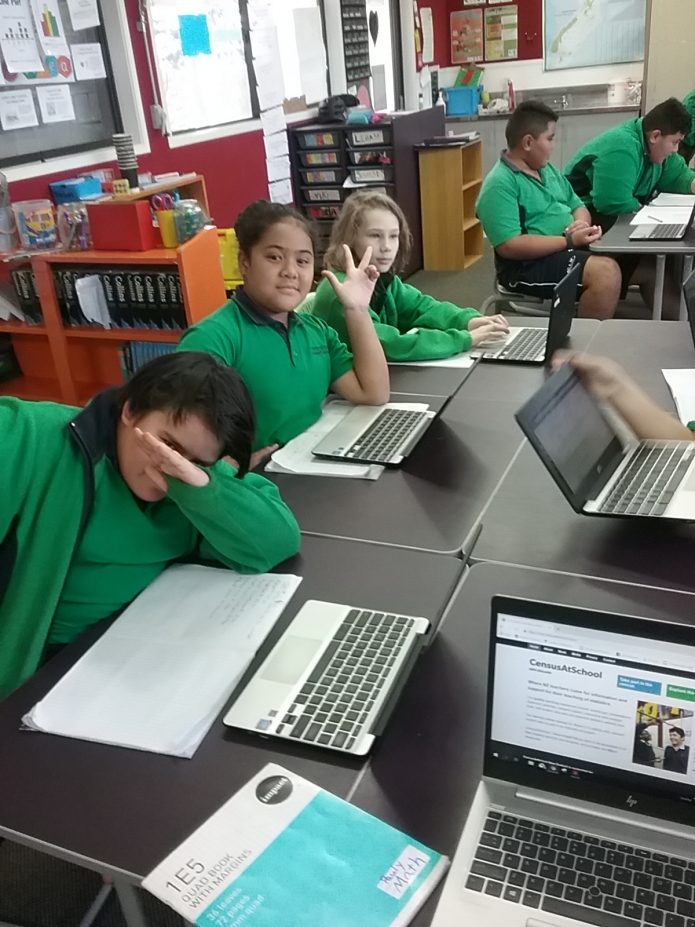
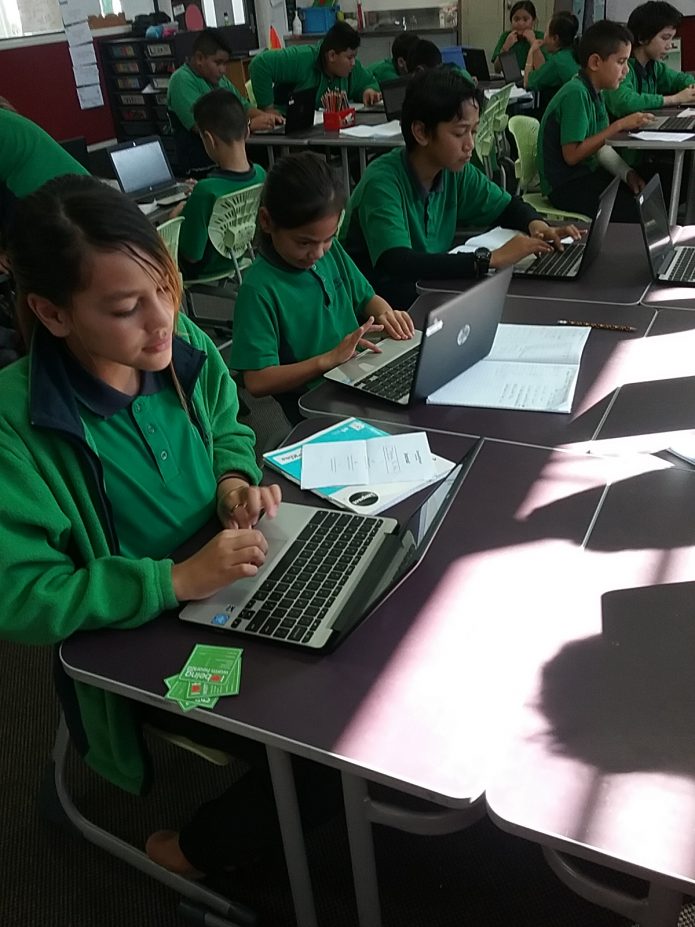
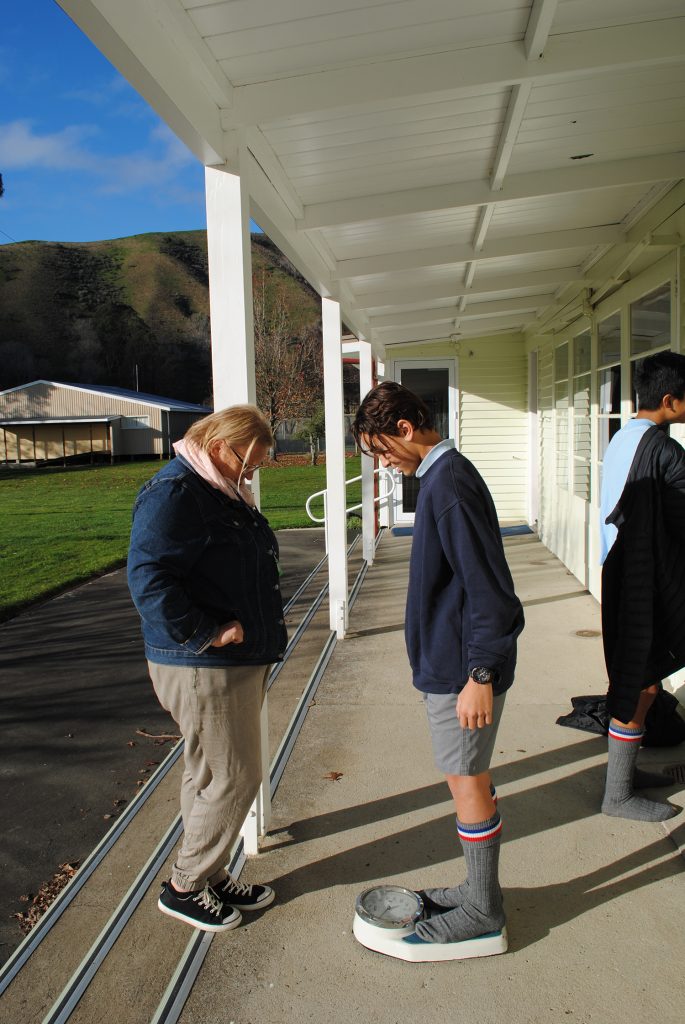
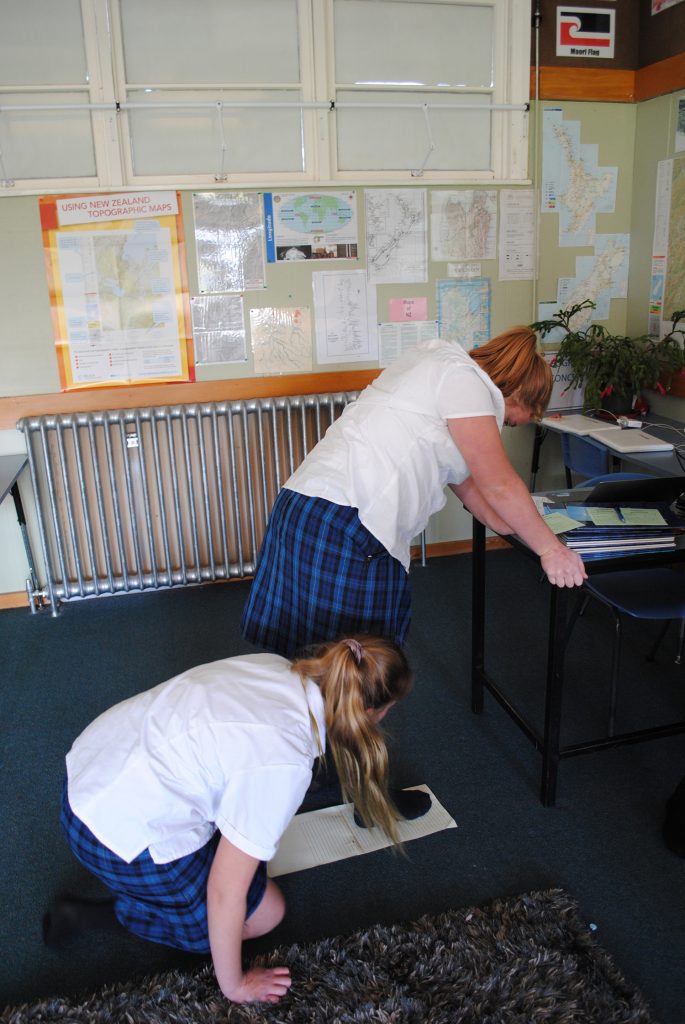
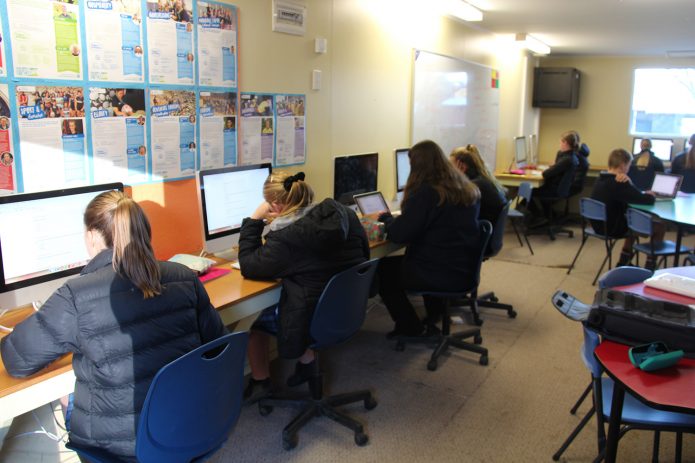
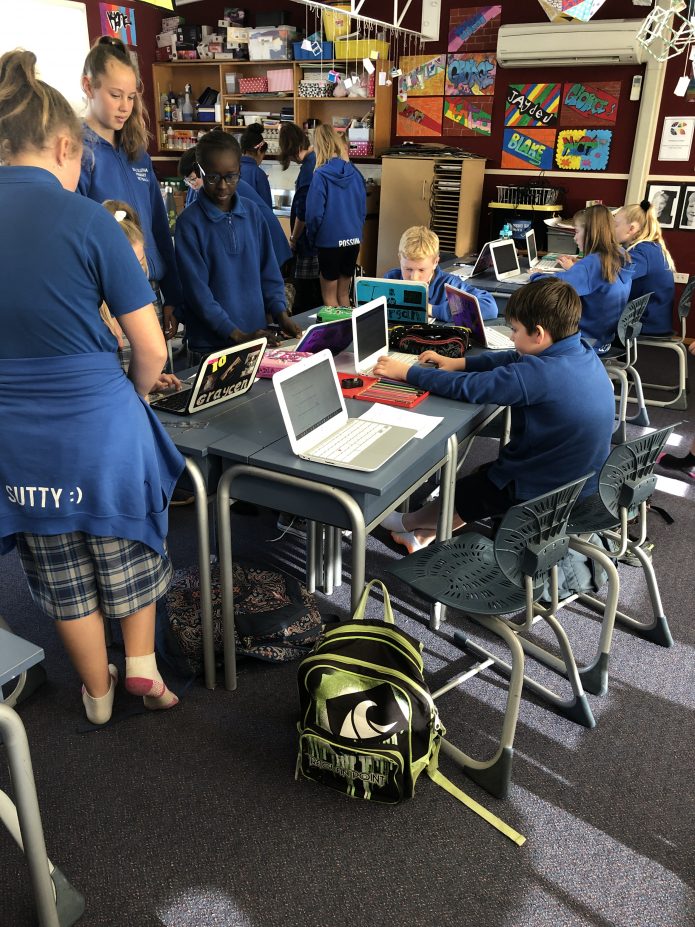
The insight comes from CensusAtSchool TataurangaKiTeKura, a non-profit, online educational project that brings statistics to life in both English and Māori-medium classrooms. Supervised by teachers, students from Years 5-13 anonymously answer 30 questions in English or te reo Māori on digital devices. The project is run by the Department of Statistics at the University of Auckland in partnership with the Ministry of Education and StatsNZ.
This year, more than 2,840 Year 11-13 students (aged 15-18) only were asked: How wrong do you think it is for someone your age to a) drink alcohol b) smoke tobacco cigarettes; c) smoke e-cigarettes d) smoke marijuana. They were able to choose a range of options on a scale from ‘not at all wrong’ to ‘very wrong’. The results showed that 61% of students felt that it was very wrong for people their age to smoke cigarettes, followed by smoking marijuana (52%), smoking e-cigarettes (44%), and drinking alcohol (22%).
Students were also asked how their parents/caregivers would feel about them doing the same things. The results were smoking cigarettes (81% of students felt that parents would consider this very wrong); marijuana (76%); e-cigarettes (69%) and alcohol (33%).
CensusAtSchool co-director Rachel Cunliffe says that the finding that smoking cigarettes, which is legal, was rated as worse behaviour than smoking marijuana, which is illegal for recreational use, was surprising. “Our figures can’t tell us why students perceived smoking cigarettes as worse than smoking marijuana,” she says. “However, we can speculate that it has something to do with what they see and hear around them and changing societal attitudes.”
For example, New Zealand has had an anti-smoking law since 1990, which has discouraged and denormalised smoking for all of these students’ lives and most of their parents’ existence. Twenty-five years ago, one in four people aged 15 or over smoked daily; today, the tally is 13%.
In contrast, although marijuana is illegal, it is the most-used illicit drug in New Zealand, with researchers estimating that by the age of 21, around 80% of young people will have used marijuana at least once. Pressure to legalise marijuana for recreational use has built to the extent that New Zealanders will choose whether or not to legalise and regulate it in a referendum alongside the general election next year.
In other findings:
- The older teens became, the less likely they were to see drinking alcohol as a bad thing for people their age to do. In Year 11, 28% of students saw drinking alcohol as very wrong. By Year 13, that figure was 12%.
- As students aged, they perceived that their caregivers relaxed over the issue of them drinking as well. One in two Year 11 students (42%) felt that their parents would see drinking alcohol as a bad thing for people their age to do. By Year 13, that figure was one in six (17%).
- However, this was not the case with cigarettes, with less of a drop as students aged. In Year 11, 65% felt that cigarette smoking by their age group was very wrong, compared to 55% in Year 13.
- The figures for perceived parental attitudes towards teens smoking cigarettes did not drop much with age. A total of 82% of Year 11s said their parents would view their age group smoking as very wrong, compared to 79% of Year 13 students.
CensusAtSchool runs every two years. This year’s census, the ninth, was launched on March 4. More than 23,000 students from 458 schools have taken part to date. See if your local school has participated here.
CensusAtSchool is part of an international effort to boost statistical capability among young people and is carried out in Australia, Canada, the United States, Japan and South Africa. The countries share some questions so comparisons can be made.