CensusAtSchool New Zealand – TataurangaKiTeKura Aotearoa celebrates the launch of their tenth biennial survey today to once again comprehensively chart children’s views of their own lives. The large national survey will give another intriguing glimpse into school children’s lives.
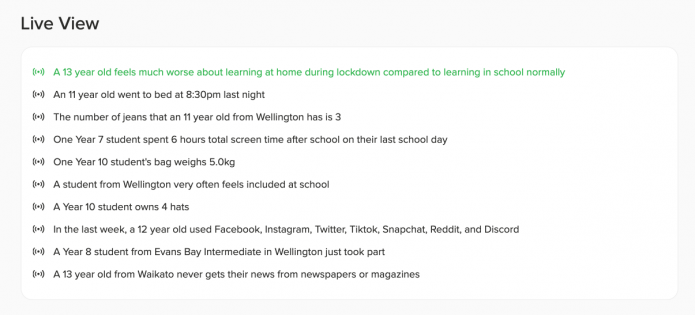
Thousands of primary, intermediate, and secondary school students around the country will share their views on issues as wide-ranging as climate change, the amount of time they spend on digital devices, where young people get their news from, and how they felt about lockdown learning. Senior students will be asked to also share their own attitudes to when they think it should be legal to drive, vote, buy alcohol, and vape.
The students are taking part in CensusAtSchool New Zealand – TataurangaKiTeKura Aotearoa, a non-profit, online educational project that aims to bring statistics to life in both English and Māori-medium classrooms. It is run by the Department of Statistics at the University of Auckland in partnership with the Ministry of Education and Stats NZ.
Supervised by teachers, students from years 3-13 anonymously answer questions in English or te reo Māori on digital devices. Some questions involve practical activities such as measuring the length of their feet and weighing their laden school bags.
The tenth biennial edition of CensusAtSchool is expected to have the highest number of schools, teachers, and students participating. More than 30,000 schoolchildren are expected to participate in CensusAtSchool this year. As of launch this morning, approximately 1,800 teachers from almost 1,000 schools had already registered – the highest figures ever.
Co-director Rachel Cunliffe says, “We’re passionate about getting real, relevant data about New Zealand students into their hands so that they can grow their data science superpower skills.”
Rachel Cunliffe, a former University of Auckland statistics lecturer who now runs a digital design company, says teachers are always looking for rich cross-curricular classroom activities.
Professor Chris Wild, statistics education expert and co-director says, “The students experience the whole statistical cycle – they complete the survey and then use statistical methods to explore the data and tell the stories in it. It helps students see the importance of statistics in today’s world – and they love finding out what other students are thinking and doing.”
CensusAtSchool is part of an international effort to boost statistical capability among young people and is carried out in Australia, Canada, the United States, Japan, and South Africa. The countries share some questions so comparisons can be made.
Preview the questions and see which schools are taking part on CensusAtSchool’s website: www.censusatschool.org.nz