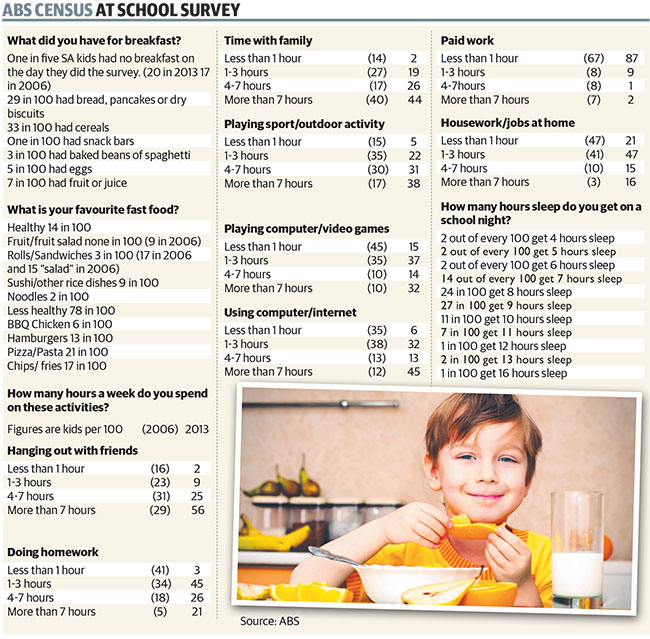
“THE average Aussie student starts the day with cereal, travels by car to school and relaxes by spending time online; gaming if they are boys and social networking for girls.
A new Census at School snapshot from the Australian Bureau of Statistics also shows their favourite takeaway food is pizza or pasta (21.5 per cent), followed by hot chips (15.3 per cent).
They are more worried about stopping bullying than any other social issue, followed by having healthy habits, access to the internet and conserving water.
Environmental consciousness is high for the 21,617 students surveyed, with 86.9 per cent turning off the tap when they brush their teeth, more than 80 per cent of households recycling and more than half having shorter showers to save water and or turning off appliances to save power when not in use.”
More results are out from CensusAtSchool Australia:
The CensusAtSchool survey findings, released yesterday by the Australian Bureau of Statistics, show 22.3 per cent of [Australian] Territory kids are missing the most important meal of the day.
The survey was made up of voluntary responses from more than 23,700 Australian school children.
The second worst in the country was the ACT (20.1 per cent not eating breakfast) and Tasmania (18.5 per cent).
In Victoria, the best performing state, only 12.3 per cent of kids missed breakfast.
Australian CensusAtSchool have just released results from their latest survey:
Australian students say school bullying is the most important social issue to tackle, according to the latest Australian Bureau of Statistics data.
Bullying at school has been the highest rated social issue, across Australia over the last four years, ABS assistant director of education services unit Frances Mawdsley said.
“Reducing bullying has been the social issue of highest importance to Australian students since 2010, with a peak level of importance recorded in 2012,” she said.
“It has actually reduced across Australia in 2013, but still remains as the number on issue.”
Students rated the importance of reducing bullying in the survey, a median of 84 out of 100, Ms Mawdsley said.
West Australian students had rated the importance 80.4 out of 100.
The figures indicate that bullying causes a great deal of anxiety among children, ECU Child Health Promotion Research Centre Professor Donna Cross said.
USDA’s National Agricultural Statistics Service (NASS) and the American Statistical Association (ASA) have developed a new Census at School Food Preference Survey lesson plan and activities for students in grades 5-8. Building on the existing ASA Census at School program, the Food Preference Survey teaches statistical and agricultural literacy to children through common core state standards in Mathematics, Language Arts, Nutrition, Social Studies, and Family Consumer Sciences.
“Increasing statistical literacy in youth is an important way to develop the next generation of statisticians,” said NASS Administrator Dr. Cynthia Clark. “The Census at School program is a way to make statistics fun and engaging for students, allowing them to compare information about themselves with that of other students in the United States and other countries.”
Students complete an online survey and submit the data to a national database. Statistical methods and concepts are then used to compare class results with random samples from peers in the United States and other countries. Students will learn about statistics, nutrition, and cultural differences; apply graphing, mathematics, and analysis skills to real-world examples; and justify their analysis of data.
The Food Preference Survey, using three questions from the full Census questionnaire, asks students about their favorite food and beverages. The activities use the data to analyze survey results and discuss whether the results surprise the class; which foods are most popular; whether certain beverages are more popular with girls or boys; whether and how the cafeteria could use the data to plan events and meals; if there is a relationship between favorite foods and whether someone is a vegetarian; and much more. The Food Preference Survey focuses specifically on information that could be useful to agriculture-in-the-classroom teachers, as well as other teachers of the common core standards addressed.
This lesson plan was developed by the National Agricultural Statistics Service (NASS), the American Statistical Association (ASA), with guidance from the National Agriculture in the Classroom organization (www.agclassroom.org). For more information about the Food Preference Survey please visit www.nass.usda.gov/Education_and_Outreach.
Accompanying today’s release of the 2013 data we have updated CensusAtSchool’s data tools to have the same simple, clean look and feel that we introduced for the rest of the site late last year.
For data-viewer and table-maker the changes the user experiences are purely cosmetic. The way in which settings are chosen in random-sampler has changed and now provides some control of sample sizes from subpopulations.
All data tools now have a prominent “Help” button near the top of the page.
Pakuranga MP and Minister of Statistics Maurice Williamson joined Pakuranga College Year 9 maths students on Monday, May 6 as they got stuck into practical data collection on the first day of the biennial, online educational project CensusAtSchool. The data collection included measuring arm spans, recording height and answering questions such as “what allergies do you have?” and “How long does it usually take you to get to school?”
CensusAtSchool co-director Rachel Cunliffe says more than 530 schools, representing 1102 teachers are running CensusAtSchool in their maths and statistics classes until June 15, after which the data is released for classroom analysis. “Students love taking part in the activities and then, in class with their teachers, becoming “data detectives” to see what stories are in the results – and not just in their own classroom, but across the country.”
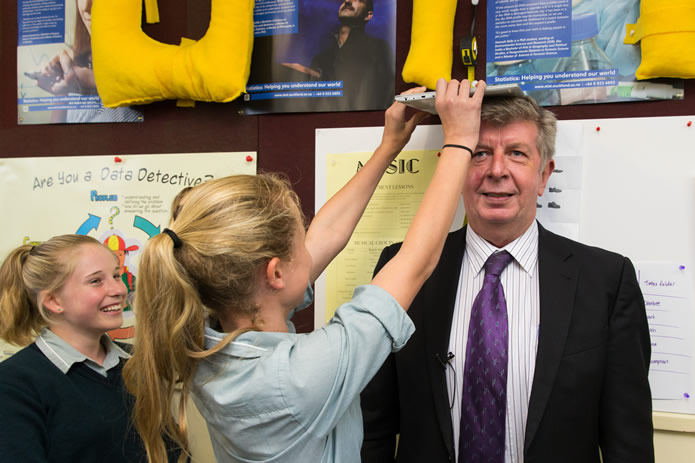
Photo: Stephen Barker, www.barkerphotography.co.nz. ©The University of Auckland.
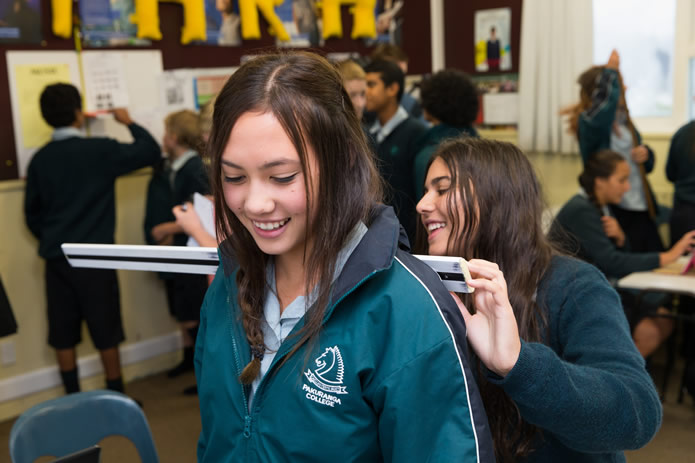
Photo: Stephen Barker, www.barkerphotography.co.nz. ©The University of Auckland.
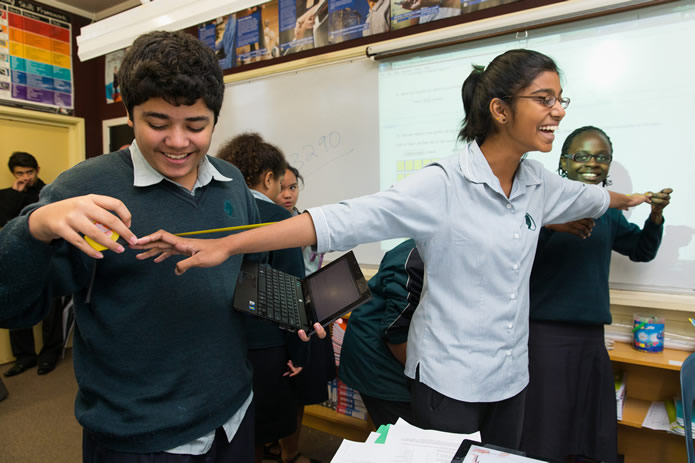
Photo: Stephen Barker, www.barkerphotography.co.nz. ©The University of Auckland.
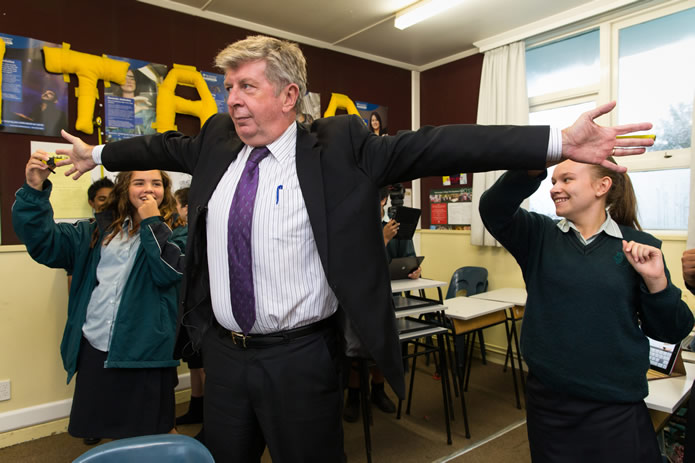
Photo: Stephen Barker, www.barkerphotography.co.nz. ©The University of Auckland.
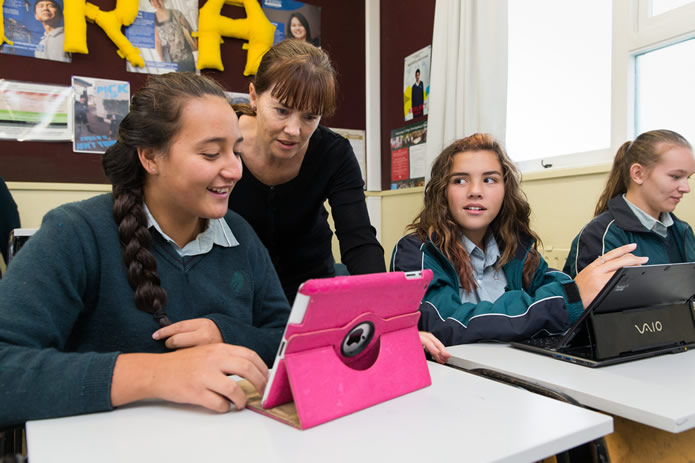
Photo: Stephen Barker, www.barkerphotography.co.nz. ©The University of Auckland.
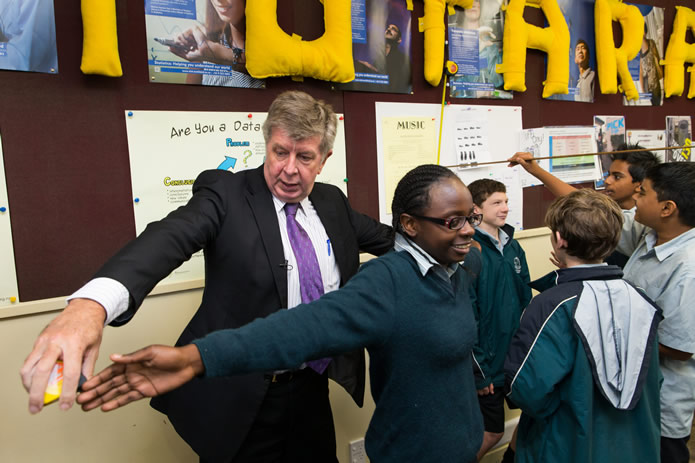
Photo: Stephen Barker, www.barkerphotography.co.nz. ©The University of Auckland.
Campbell Live filmed Maurice Williamson in the classroom as a part of their story. You can watch the clip here.
Full sized versions of these photographs and others are available for free for media use. Please contact us.
Tuesday, March 5th is the official NZ census.
The census is the official count of how many people and dwellings there are in New Zealand. It takes a snapshot of the people in New Zealand and the places wehre we live. The last census was held in 2006. Census information is needed for planning vital public services such as education, health, housing and transport. It is also used to help understand how our society changes over time.
By law everyone in New Zealand on census day must fill in a census form for the dwelling in which they are staying that evening. Check that your students know this and go home and remind their family members to fill in the form. Alternatively, they can complete their census forms online at http://www.census.govt.nz/
Statistics New Zealand
Statistics New Zealand is New Zealand’s national statistical office, collecting and publishing information the country needs to grow and prosper for nearly 120 years. You can find lots of information about New Zealand and New Zealander’s on the Statistics New Zealand website (www.stats.govt.nz), including information about businesses, population, health, and employment.
There are resources available for teachers and students at www.stats.govt.nz/schoolscorner, including the new game, Tere counts the country.
‘Tere the Tui: Tere counts the country’ is a new, free learning game, designed by Statistics New Zealand to help familiarise children with New Zealand statistics as well as statistical terms.
Players answer multi-choice questions about each region of New Zealand, finding answers in the tool Interactive Boundary Maps.
When players have correctly answered a question about each region they can choose to go in the draw to win one of 200 Census branded USB sticks.
Tere counts the country can be played by children in the classroom or at home.
2013 is the International Year of Statistics, a worldwide event supported by nearly 1,700 organizations!
The founding organizations of the International Year of Statistics—also called Statistics2013—are the American Statistical Association, Institute of Mathematical Statistics, International Biometric Society, International Statistical Institute (and the Bernoulli Society), and Royal Statistical Society. As established by the founding organizations, the campaign’s primary objectives are to do the following:
- Increase public awareness of the power and impact of statistics on all aspects of society
- Nurture statistics as a profession, especially among young people
- Promote creativity and development in the sciences of probability and statistics
Visit the website, Statistics2013 and promote Statistics as a tool for life (and possibly a career option!).
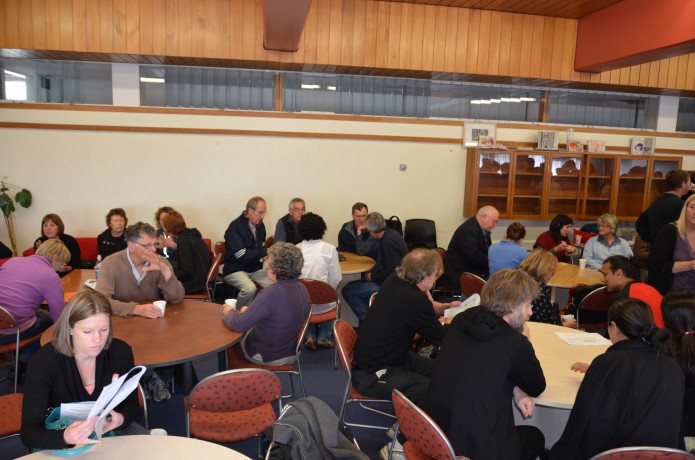
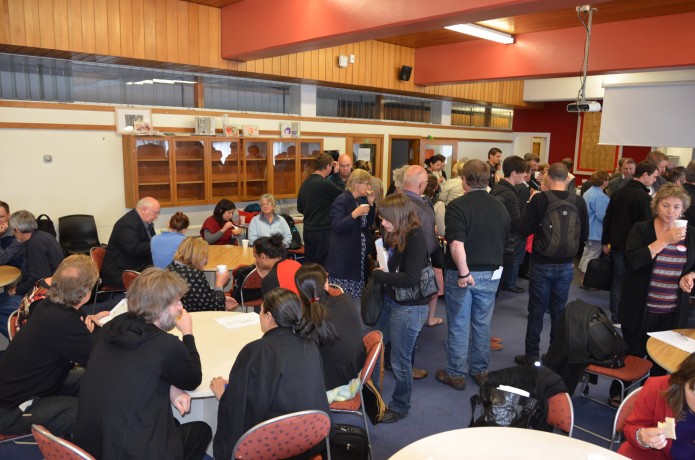
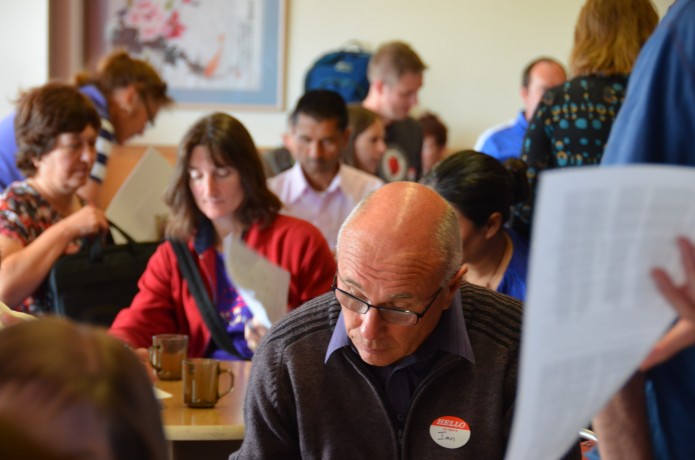
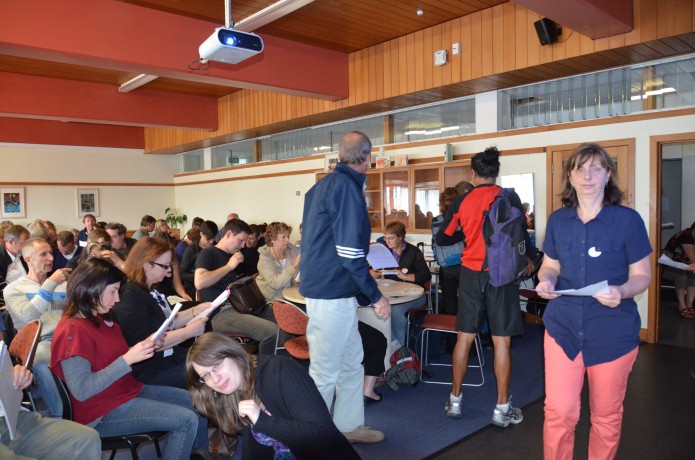
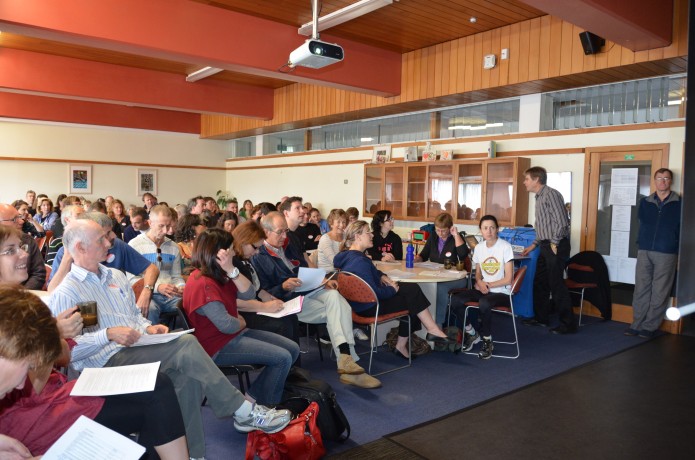
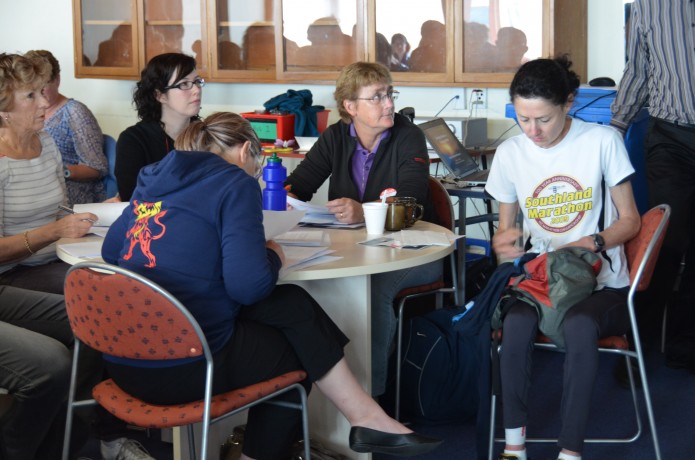
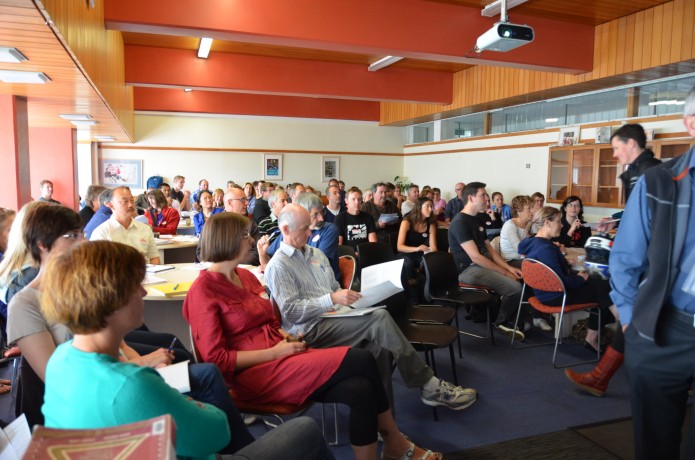
On December 1, the Wellington Mathematical Association (WMA) and the Department of Statistics ran a special event atTWellington Girls’ College for Year 13 statistics teachers. Find out more about the statistics road tour here.
Some photos from the event are below:
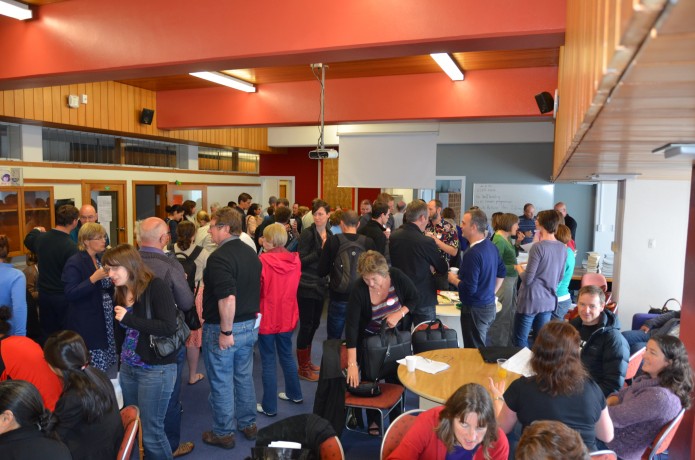
If you went along, we’d love to hear your feedback!