CensusAtSchool launches on February 13! With less than two weeks to go, here’s what you can do to prepare:
- Register if you haven’t done so already (only takes a minute)
- Let the rest of your team and colleagues know about CensusAtSchool – the more students involved the better!
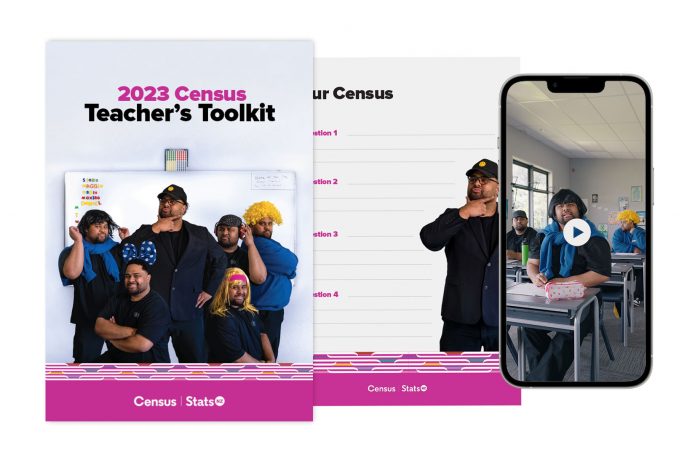
- Read the Teacher’s Guide. This is essential reading to ensure that you have everything you need to take part successfully with your students.
About CensusAtSchool New Zealand – TataurangaKiTeKura Aotearoa
CensusAtSchool New Zealand – TataurangaKiTeKura Aotearoa will launch of the eleventh biennial survey on February 13 to once again comprehensively chart students’ views of their own lives. The large national survey will give another intriguing glimpse into school students’ lives.
Thousands of primary, intermediate, and secondary school students around the country will share their views on issues as wide-ranging as their favourite ice cream flavour, the amount of time they spend on digital devices, whether or not they have blocked someone in the past week, opinions on alcohol, how many close friends they have, how happy they say they are overall, and their favourite sport to play.
CensusAtSchool New Zealand – TataurangaKiTeKura Aotearoa is a non-profit, online educational project that aims to bring statistics to life in both English and Māori-medium classrooms. It is run by the Department of Statistics at the University of Auckland in partnership with the Ministry of Education and Stats NZ.
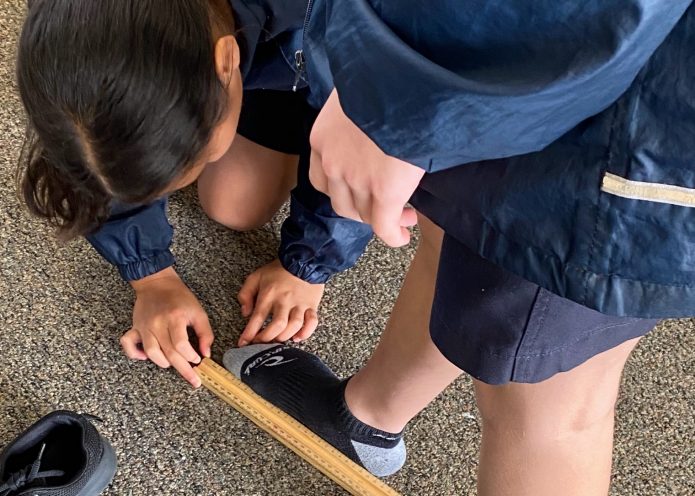
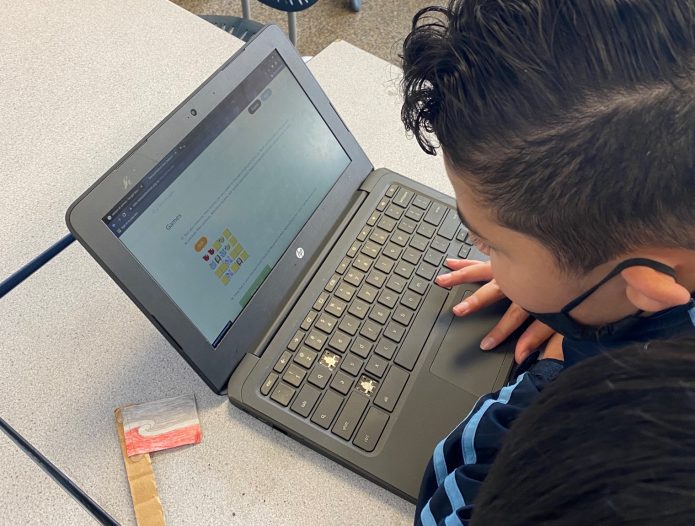
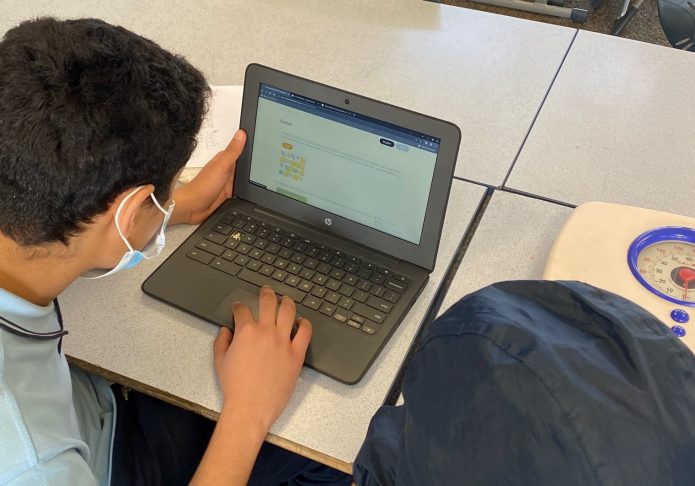
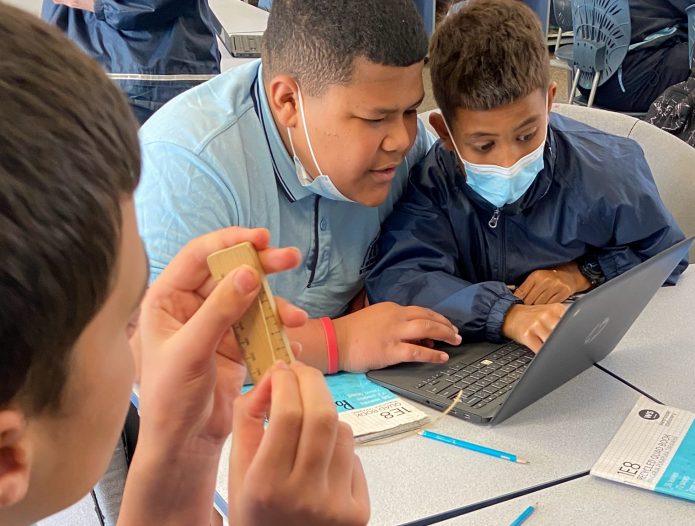
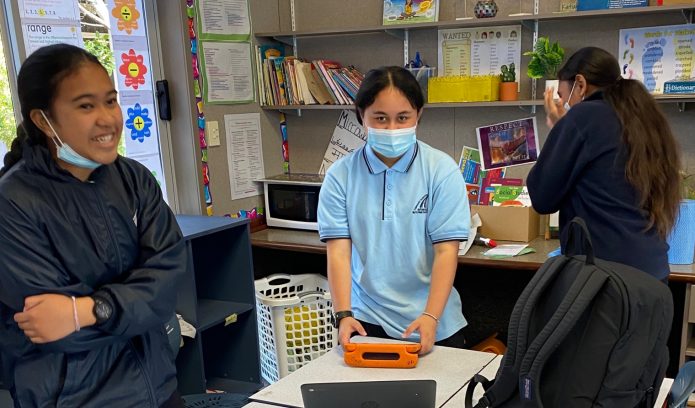
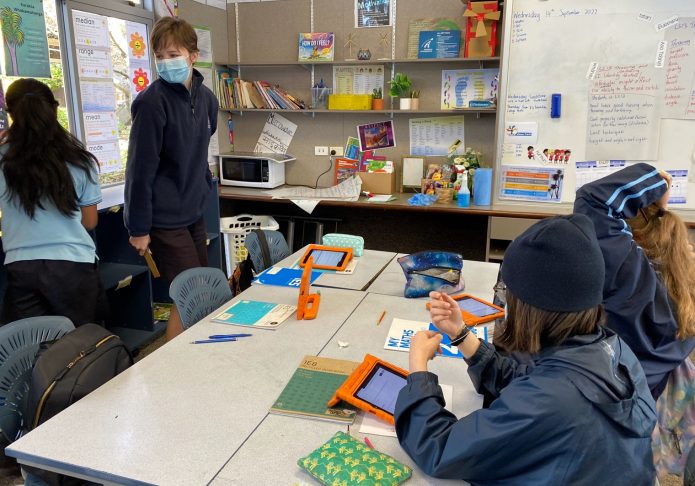
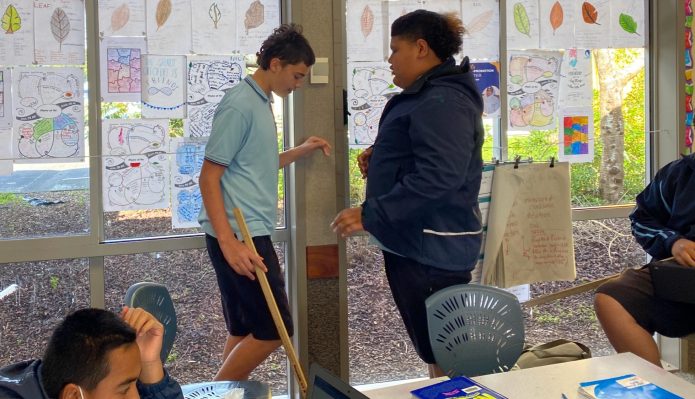
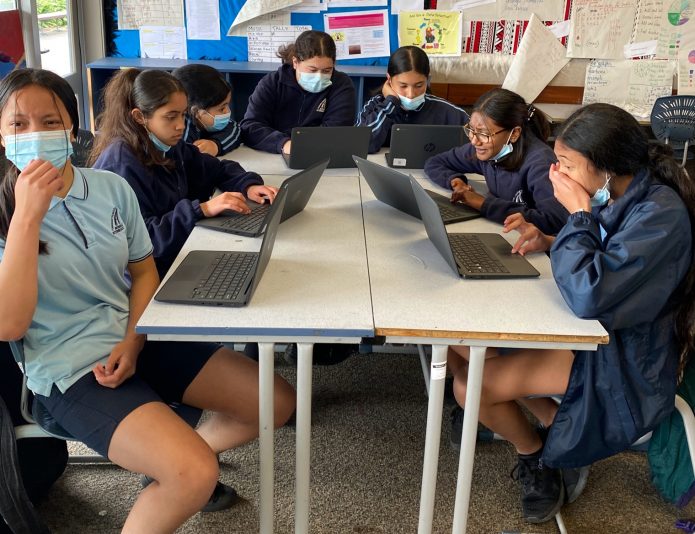
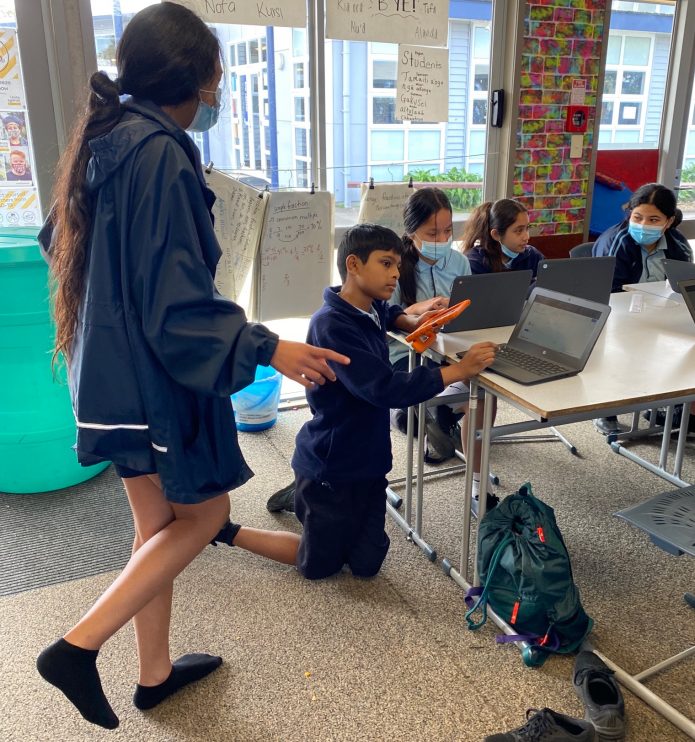
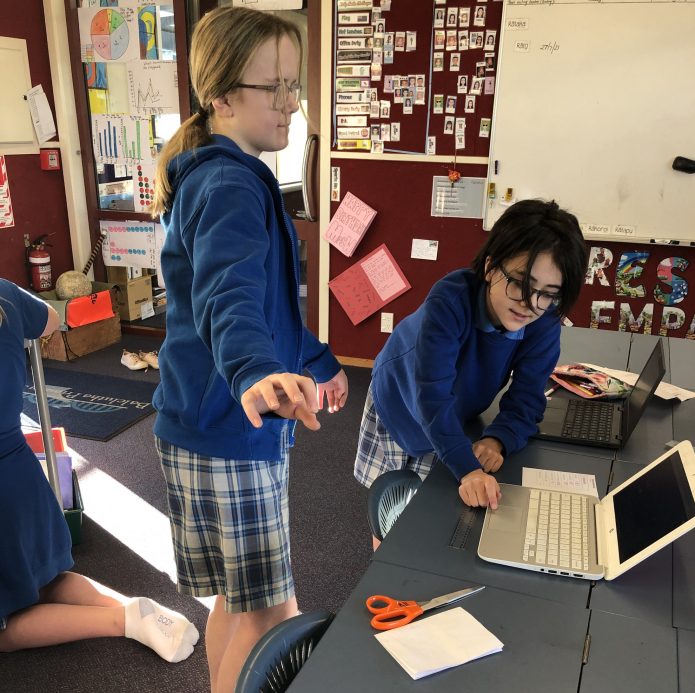
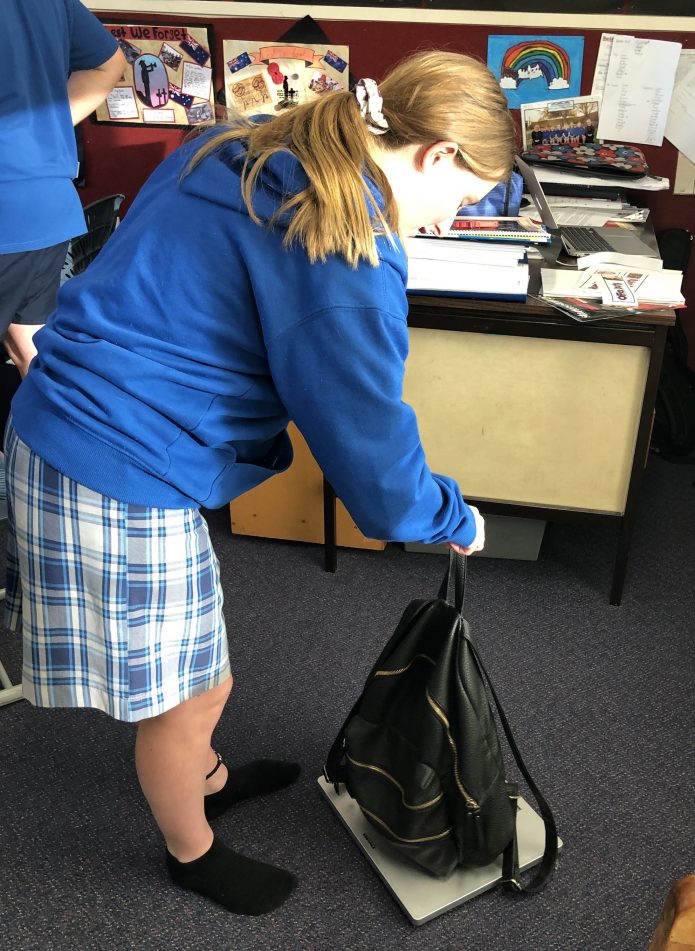
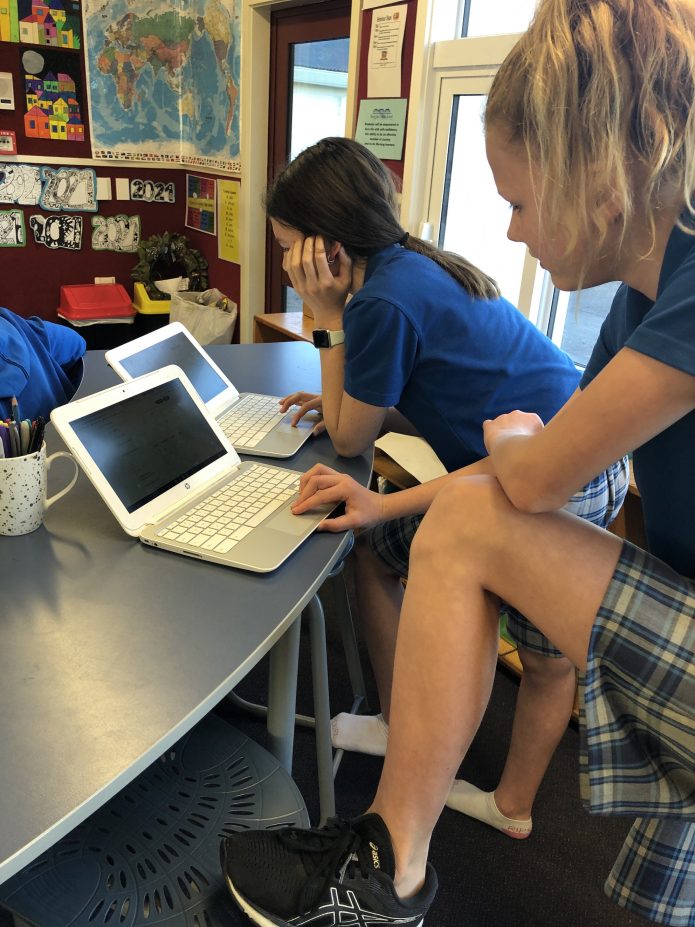
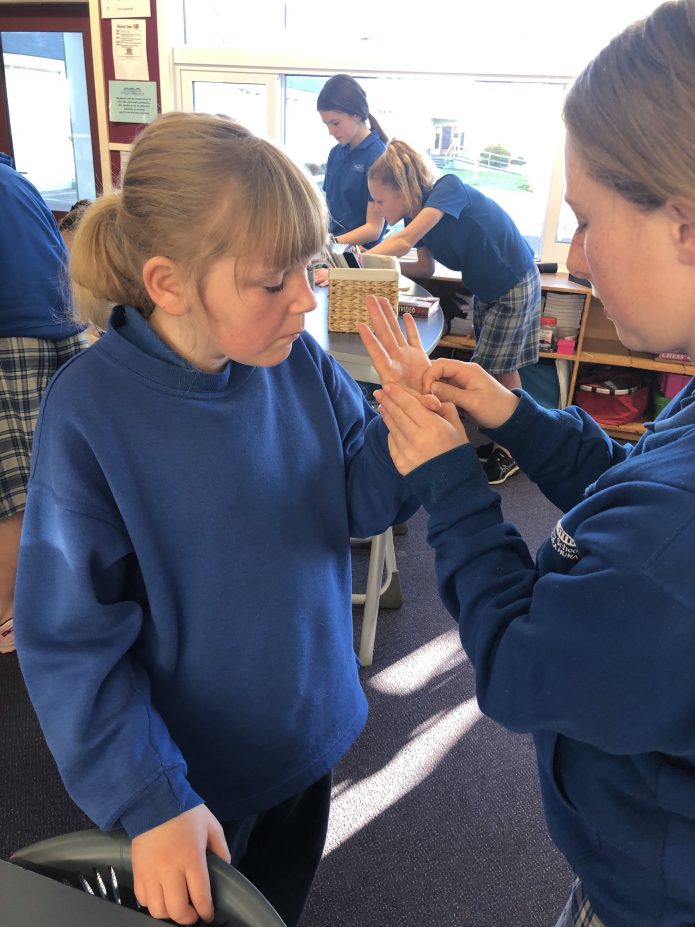
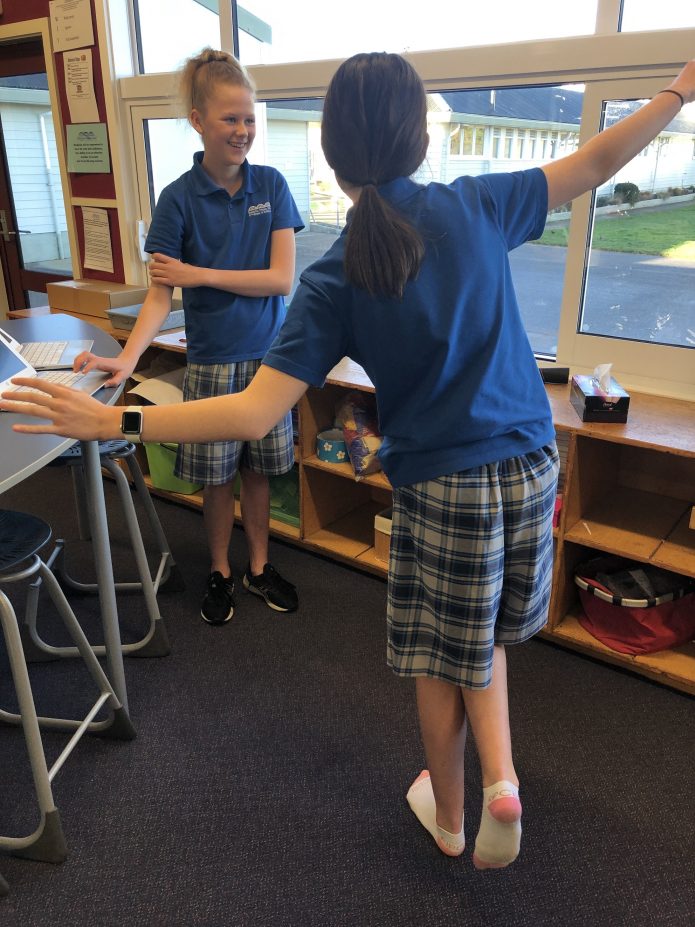
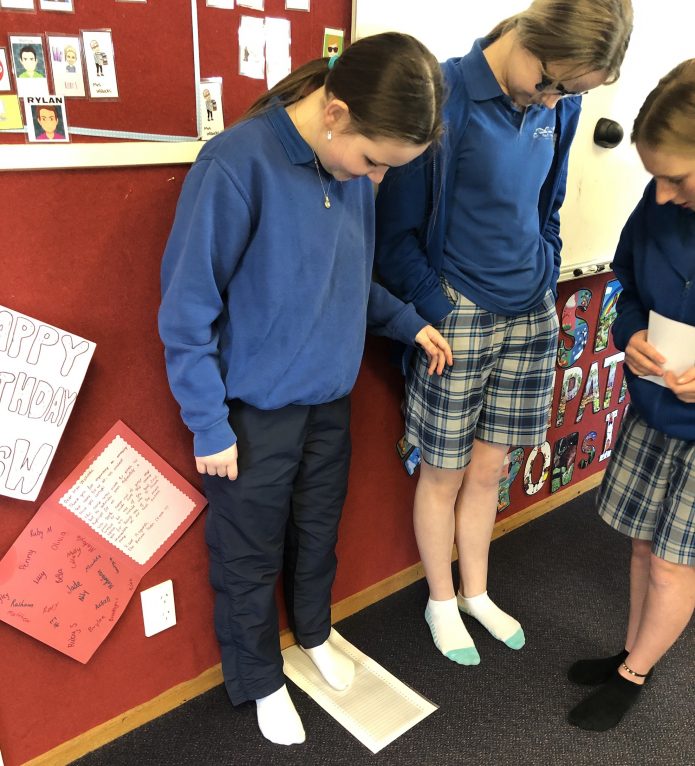
Supervised by teachers, students from years 3-13 anonymously answer questions in English or te reo Māori on digital devices. Some questions involve practical activities such as measuring the length of their feet and weighing their laden school bags.
The eleventh biennial edition of CensusAtSchool is expected to have the highest number of schools, teachers, and students participating. More than 40,000 students are expected to participate in CensusAtSchool this year.
Preview the questions and see which schools are taking part on our website.