The Australasian Region of the International Biometric Society is running a School Poster Competition for Year 9 & 10 Australian and NZ students. Entries close 10 November. More details »
Smoking cigarettes is worse teenage behaviour than smoking marijuana, according to Year 11-13 students from New Zealand schools. Furthermore, they think that their parents would agree with them.
The insight comes from CensusAtSchool TataurangaKiTeKura, a non-profit, online educational project that brings statistics to life in both English and Māori-medium classrooms. Supervised by teachers, students from Years 5-13 anonymously answer 30 questions in English or te reo Māori on digital devices. The project is run by the Department of Statistics at the University of Auckland in partnership with the Ministry of Education and StatsNZ.
This year, more than 2,840 Year 11-13 students (aged 15-18) only were asked: How wrong do you think it is for someone your age to a) drink alcohol b) smoke tobacco cigarettes; c) smoke e-cigarettes d) smoke marijuana. They were able to choose a range of options on a scale from ‘not at all wrong’ to ‘very wrong’. The results showed that 61% of students felt that it was very wrong for people their age to smoke cigarettes, followed by smoking marijuana (52%), smoking e-cigarettes (44%), and drinking alcohol (22%).
Students were also asked how their parents/caregivers would feel about them doing the same things. The results were smoking cigarettes (81% of students felt that parents would consider this very wrong); marijuana (76%); e-cigarettes (69%) and alcohol (33%).
CensusAtSchool co-director Rachel Cunliffe says that the finding that smoking cigarettes, which is legal, was rated as worse behaviour than smoking marijuana, which is illegal for recreational use, was surprising. “Our figures can’t tell us why students perceived smoking cigarettes as worse than smoking marijuana,” she says. “However, we can speculate that it has something to do with what they see and hear around them and changing societal attitudes.”
For example, New Zealand has had an anti-smoking law since 1990, which has discouraged and denormalised smoking for all of these students’ lives and most of their parents’ existence. Twenty-five years ago, one in four people aged 15 or over smoked daily; today, the tally is 13%.
In contrast, although marijuana is illegal, it is the most-used illicit drug in New Zealand, with researchers estimating that by the age of 21, around 80% of young people will have used marijuana at least once. Pressure to legalise marijuana for recreational use has built to the extent that New Zealanders will choose whether or not to legalise and regulate it in a referendum alongside the general election next year.
In other findings:
- The older teens became, the less likely they were to see drinking alcohol as a bad thing for people their age to do. In Year 11, 28% of students saw drinking alcohol as very wrong. By Year 13, that figure was 12%.
- As students aged, they perceived that their caregivers relaxed over the issue of them drinking as well. One in two Year 11 students (42%) felt that their parents would see drinking alcohol as a bad thing for people their age to do. By Year 13, that figure was one in six (17%).
- However, this was not the case with cigarettes, with less of a drop as students aged. In Year 11, 65% felt that cigarette smoking by their age group was very wrong, compared to 55% in Year 13.
- The figures for perceived parental attitudes towards teens smoking cigarettes did not drop much with age. A total of 82% of Year 11s said their parents would view their age group smoking as very wrong, compared to 79% of Year 13 students.
CensusAtSchool runs every two years. This year’s census, the ninth, was launched on March 4. More than 23,000 students from 458 schools have taken part to date. See if your local school has participated here.
CensusAtSchool is part of an international effort to boost statistical capability among young people and is carried out in Australia, Canada, the United States, Japan and South Africa. The countries share some questions so comparisons can be made.
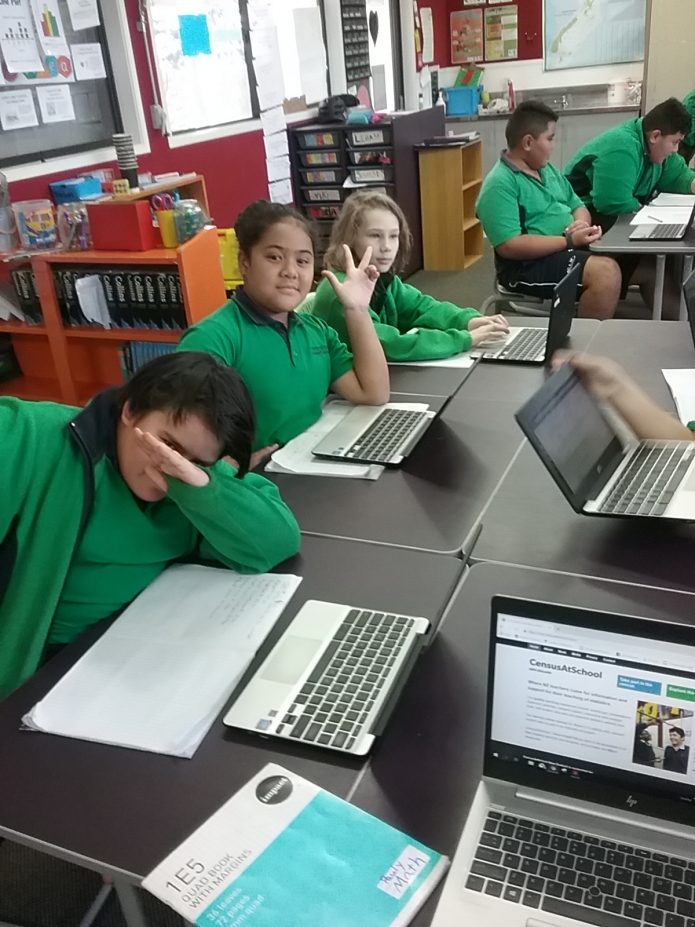
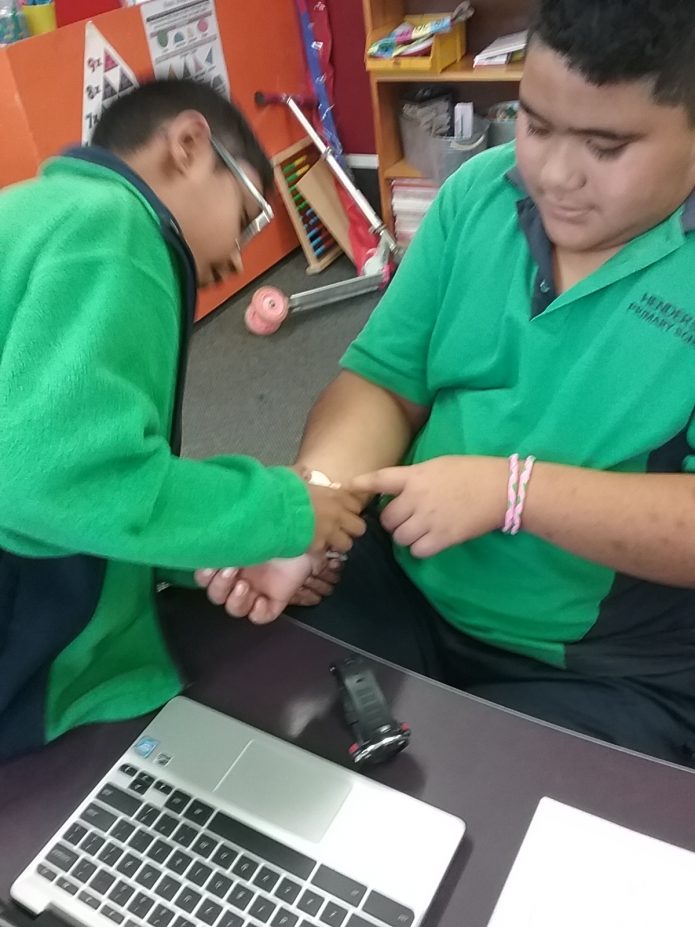
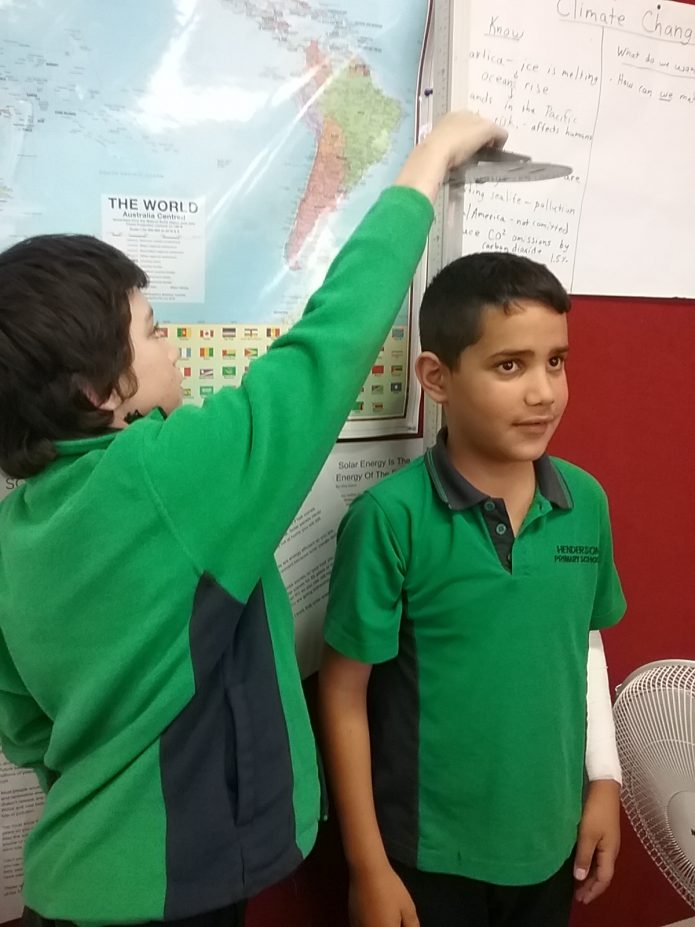
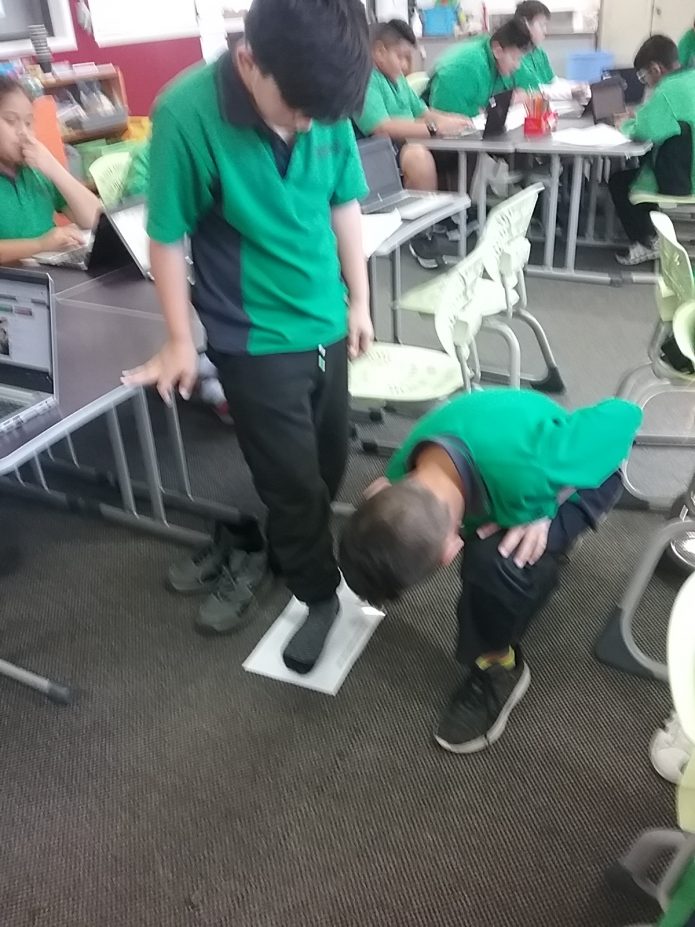
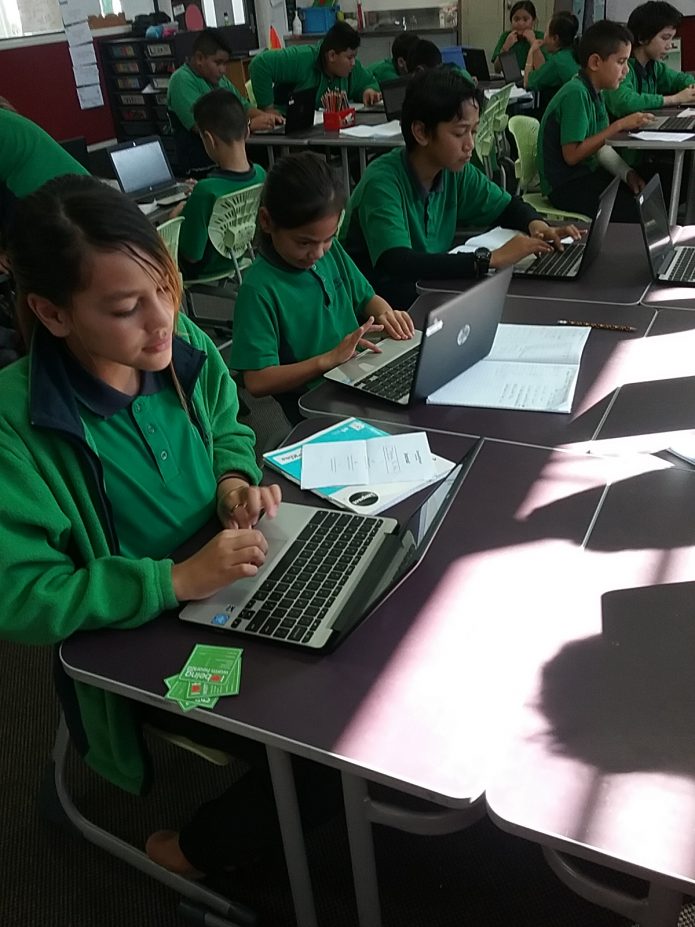
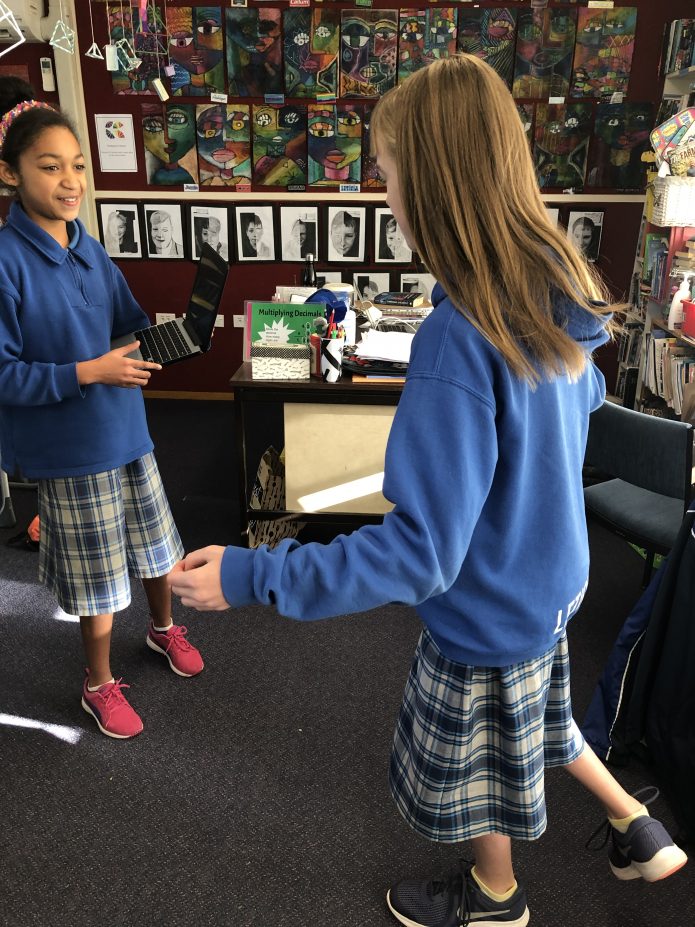
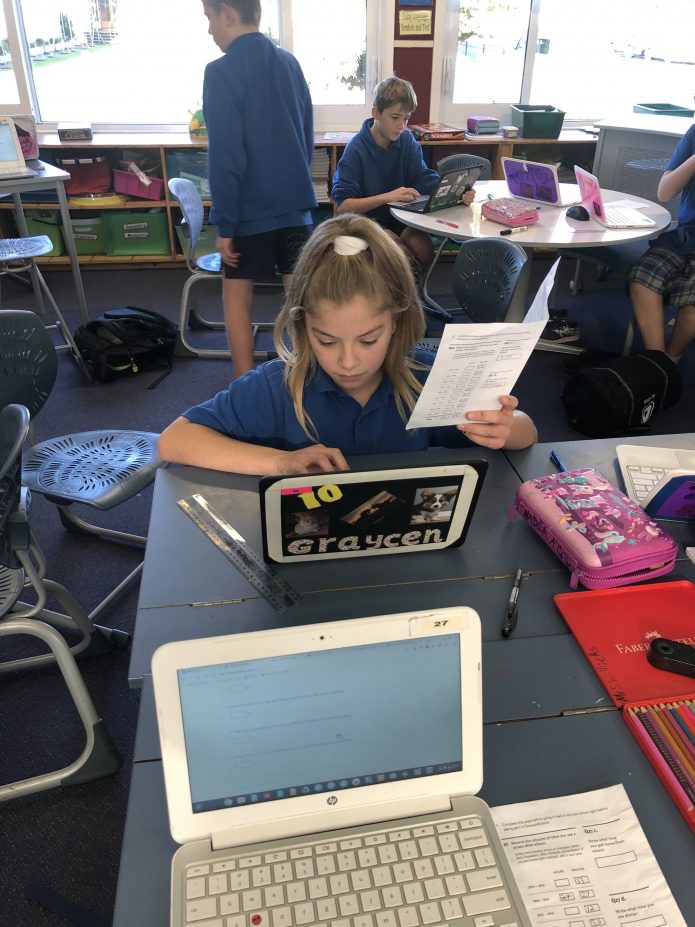
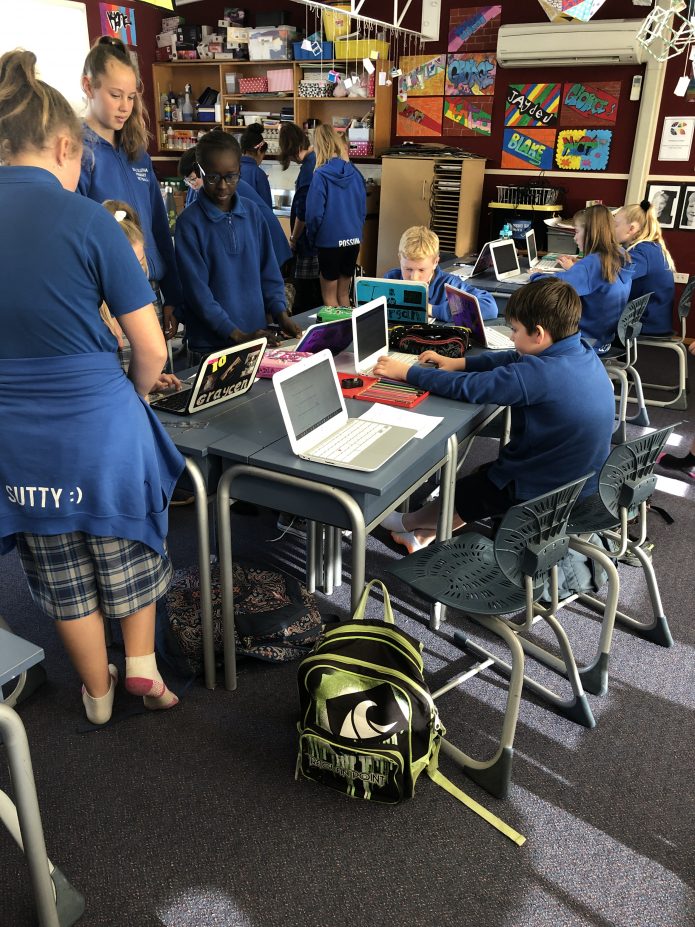
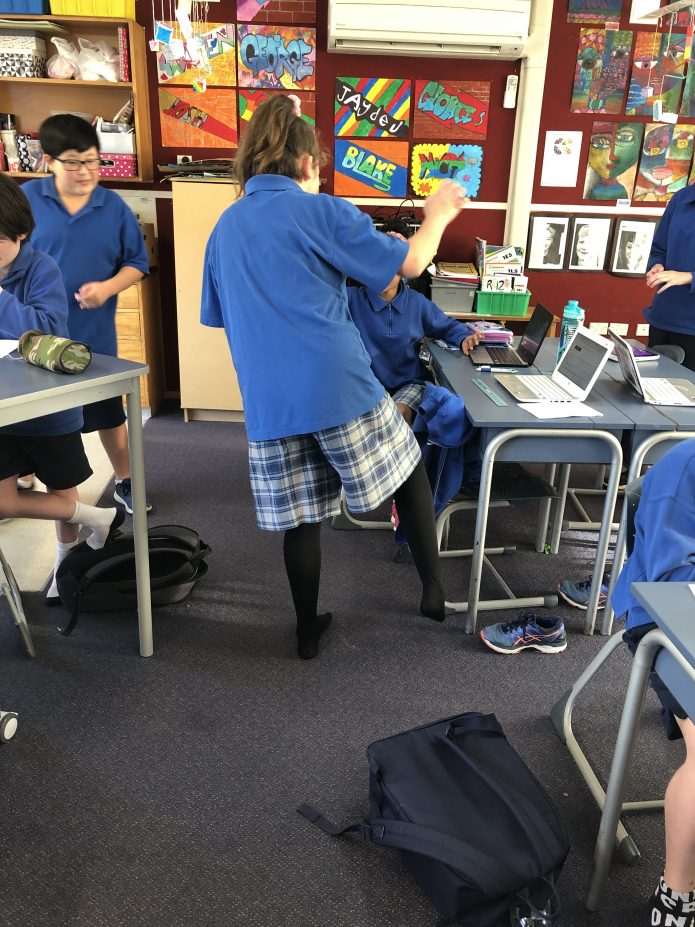
Thanks to Tara Boreham for sharing these photos of her students at Henderson Primary taking part in CensusAtSchool last term.
Thanks to Susan Fenemor for sharing these photos of her students at Tapawera School taking part in CensusAtSchool last term.
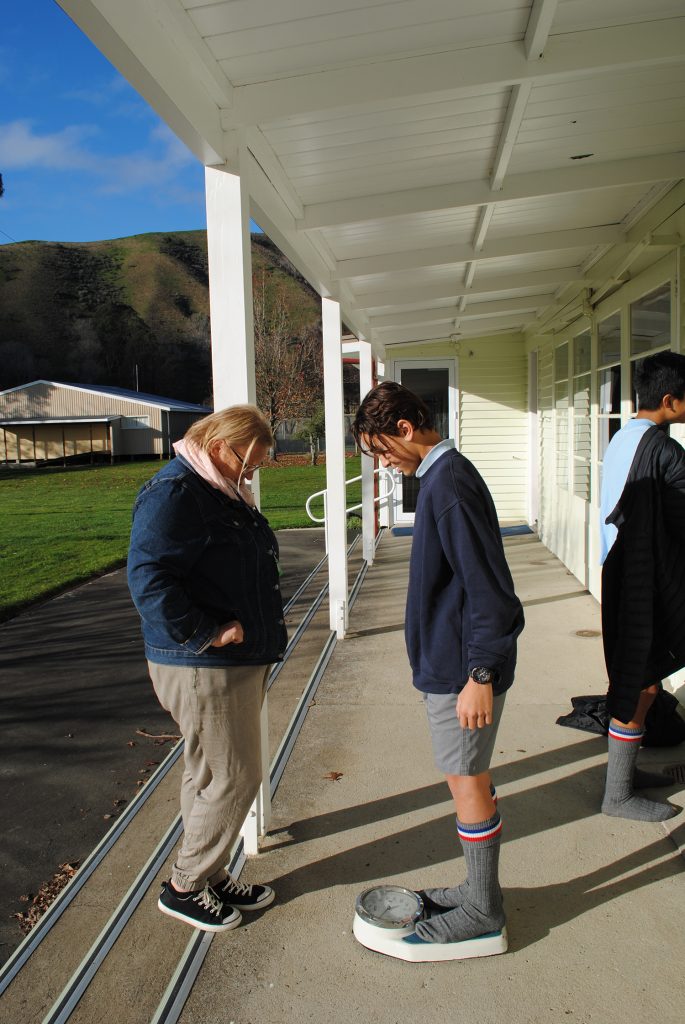
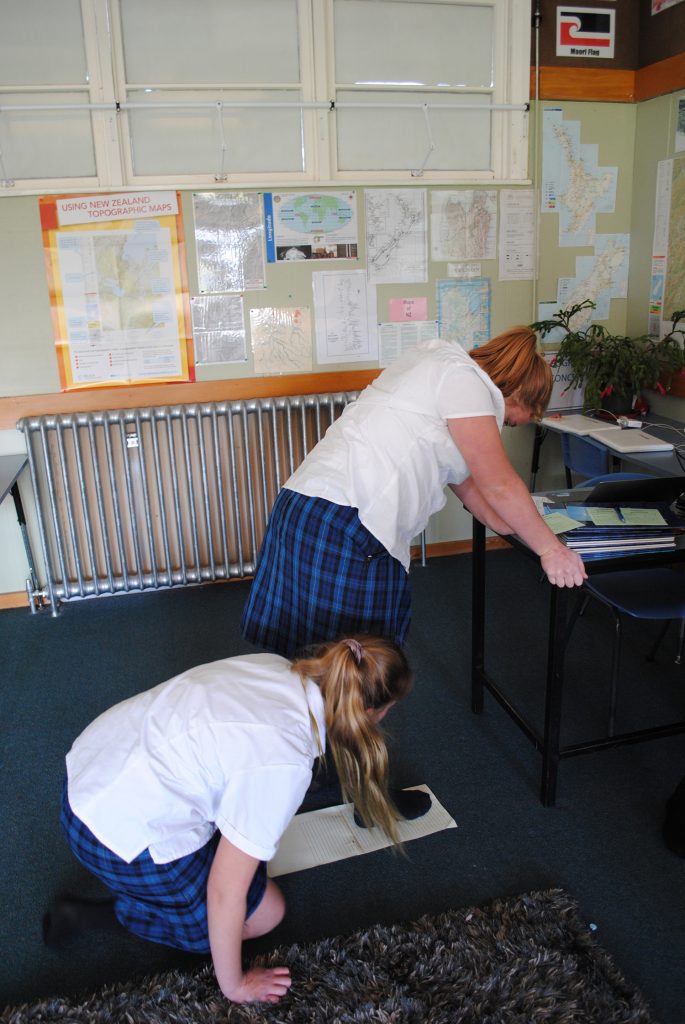
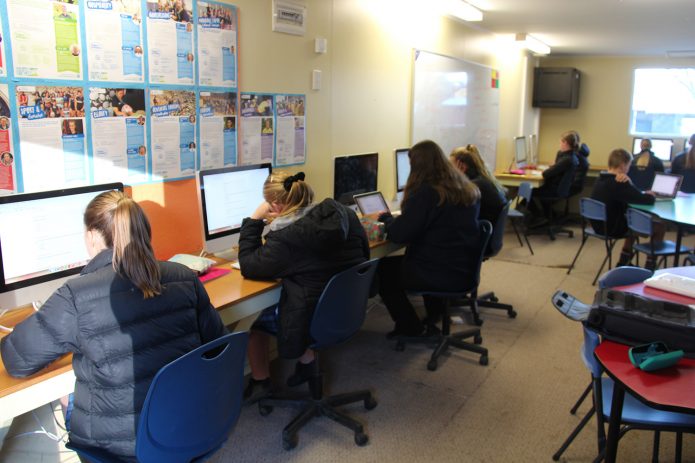
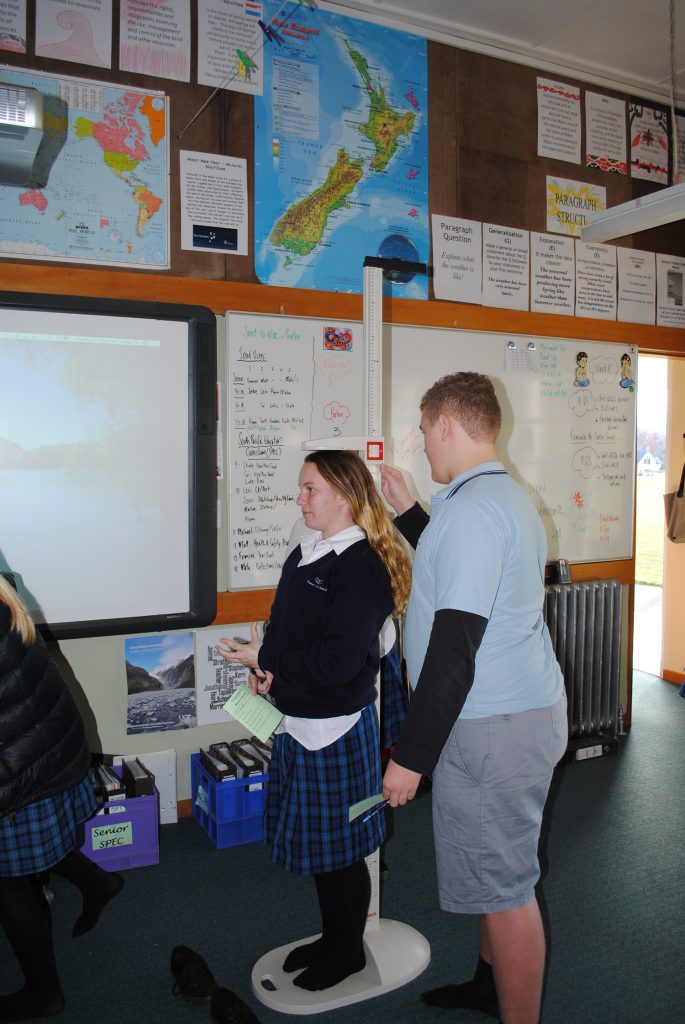
Thanks to Gabriela Isolabella for sharing these photos of her students at Hastings Girls High School taking part in CensusAtSchool last term.
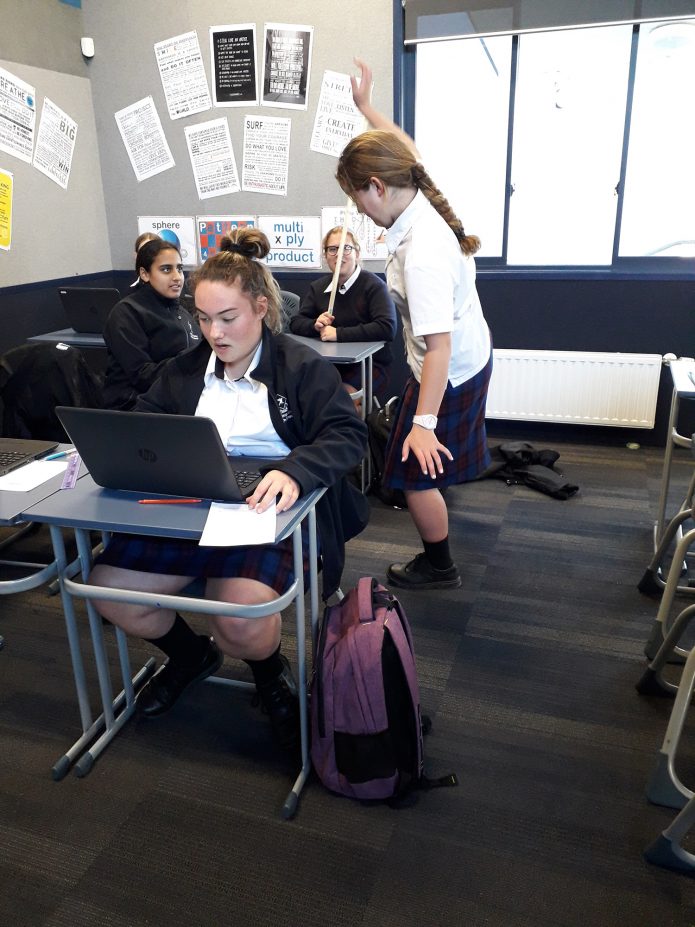

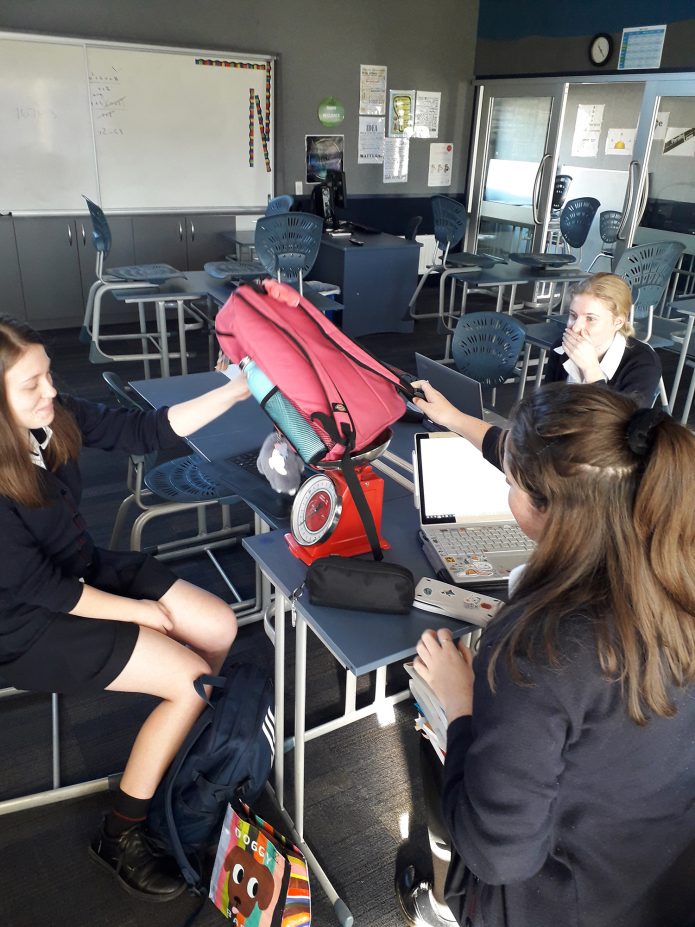

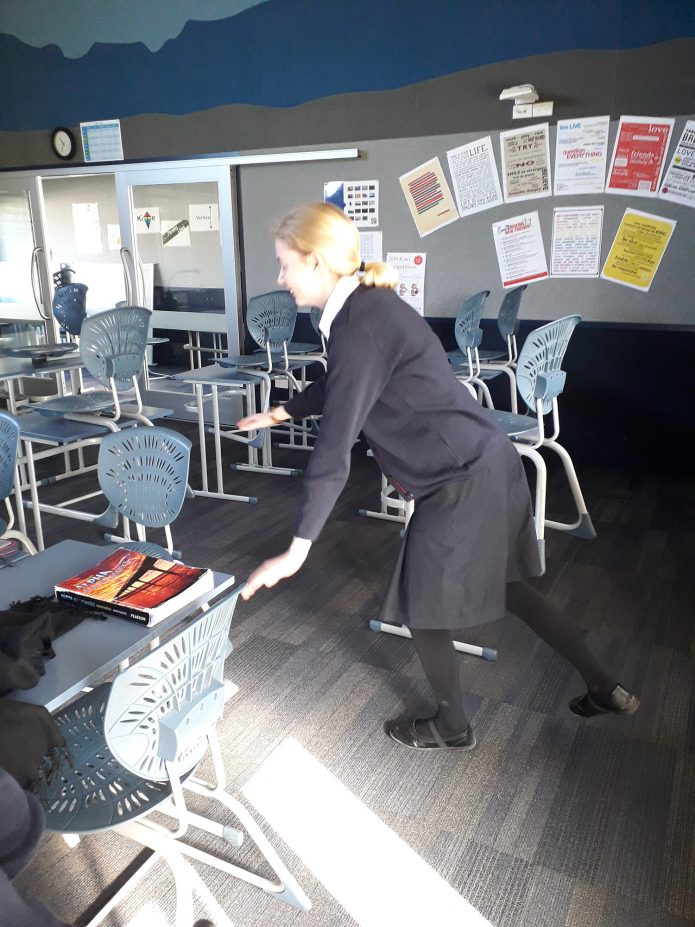
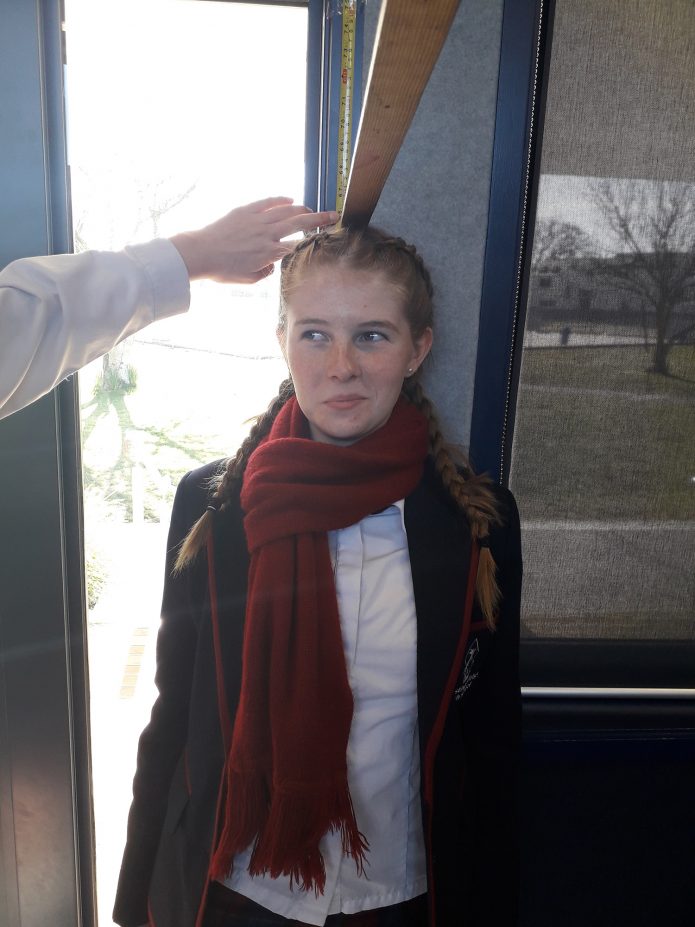
Thanks to Kristina Sheppard for sharing these photos of her Year 7 class at Ashburton Intermediate taking part in CensusAtSchool recently.
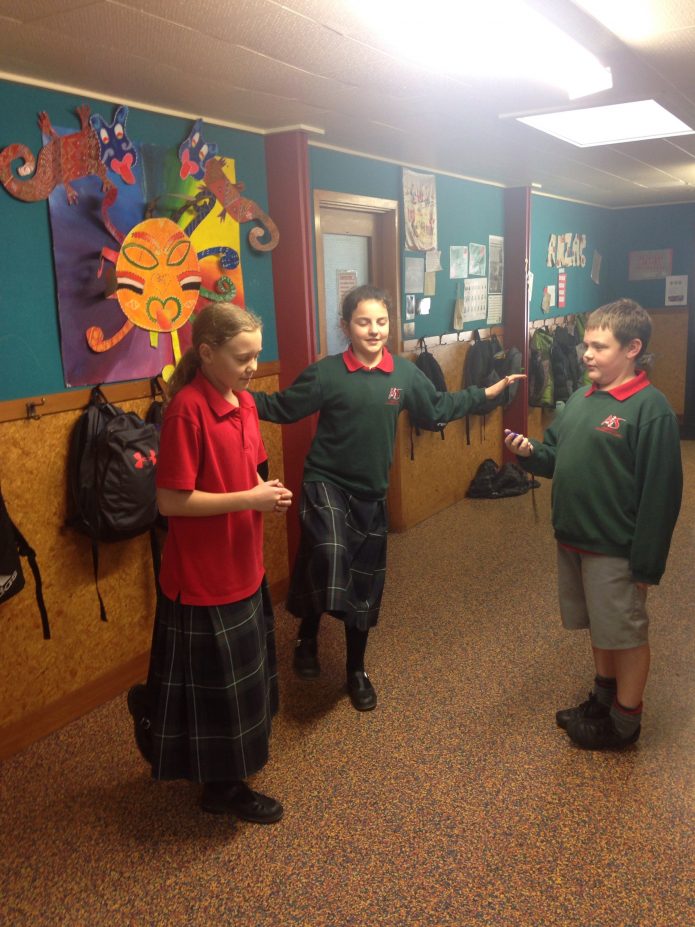
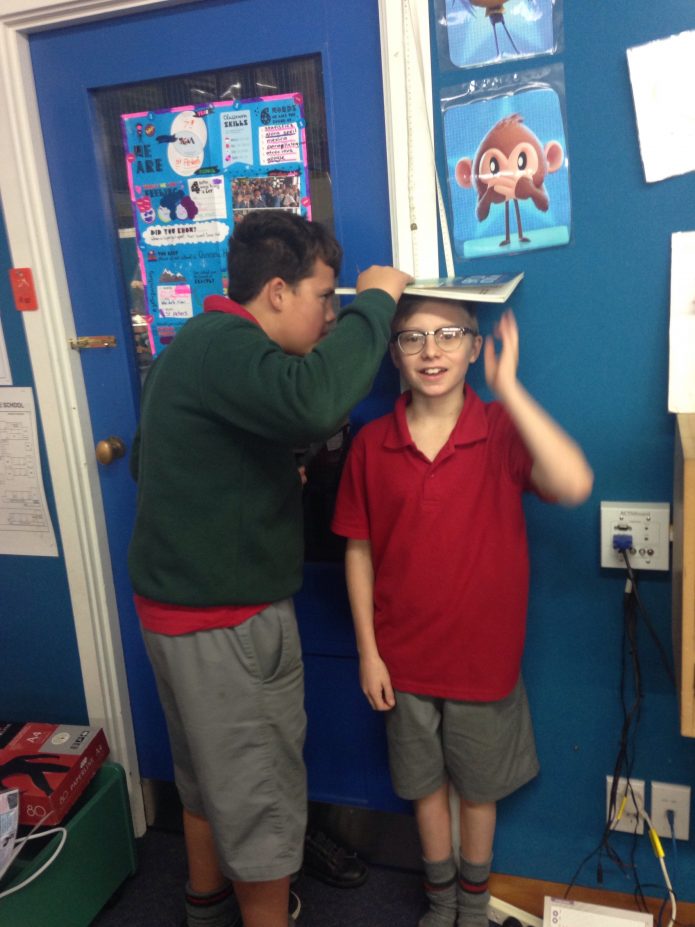
Thanks to Heather Willocks for sharing these photos of her class at Balclutha Primary School taking part in CensusAtSchool on Friday.
One in three New Zealand high-school students say they spend too much time on social media, the latest results of a nationwide survey reveal.
The insight comes from CensusAtSchool TataurangaKiTeKura, a non-profit, online educational project that brings statistics to life in both English and Māori-medium classrooms. Supervised by teachers, students from Years 5-13 anonymously answer 30 questions in English or te reo Māori on digital devices.
This data comes from the first 12,000 students to complete the census. This year, students were asked whether the time they spent on social media accounts was about right, too little or too much. Overall, one in three high-school students felt that their use of social media was excessive. This was highest among girls, with 40% spending too much time on social media, compared with just 20% for boys.
CensusAtSchool co-director Rachel Cunliffe says that the findings suggest that students are well aware of public discussion about the drawbacks of social media. “Connecting with peers is important to young people, and they seem to know about the pros and cons of using social media. The fact they’re reflecting on their own use of social media is a good thing.”
In other findings, one in three boys in primary school (33%) and secondary school (30%) believe that their time spent playing video games is excessive. However, 45% of primary girls and 65% of high-school girls said they don’t get enough time playing video games.
In other findings:
- Facebook has fallen from favour with younger high-school students, with Instagram taking its place. In 2011, 80% of Year 9 students had a Facebook profile. This steadily declined to 33% in 2019. Now, 78% of Year 9 students have Instagram, up from 66% in 2015.
- 49% of high schoolers with a phone say that they always or often check for messages and notifications as soon as they wake up in the morning.
- Half of high-school students say a weekend without their phone would make them feel angry, anxious, frustrated, sad, or lonely. Students could choose from as many as applied from angry, anxious, frustrated, happy, lonely, relieved, sad, neutral, and other. A total of 12% chose angry, 15% chose anxious, 14% chose lonely, 14% chose sad, and 24% said that they would feel frustrated.
CensusAtSchool runs every two years. This year’s census, the ninth, was launched on March 4 and runs until July 5. During that time, up to 30,000 school children are expected to participate. More than 1,990 teachers from 906 schools have registered; see if your local school is taking part here.
CensusAtSchool is part of an international effort to boost statistical capability among young people and is carried out in Australia, Canada, the United States, Japan and South Africa. The countries share some questions so comparisons can be made.
A few teachers have contacted us with questions and feedback about Question 1 in the questionnaire which asks if students are male or female, so in this email, I’ll explain more to everyone.
Firstly, it is great that you and your students are thinking and talking about the questions and answers! This is an important part of survey design.
Some of our CensusAtSchool questions match word-for-word with the official Census questions. This means that we use tried-and-tested and familiarly worded demographic questions which have been tailored to the New Zealand context, such as asking birth country and ethnicity.
Many people assume that the first question we ask (and that the official Census asks) is about gender identity. However, it is asking about biological sex.
It is easy to get these mixed up as the question itself does not say either one in the wording!
Added to that, there has been a tradition of using the word ‘gender’ in school environments when we really mean ‘sex’ because of the long-recognised problem of many kids getting silly whenever the word ‘sex’ is mentioned.
Now that gender identity has come much more to the forefront of society’s attention, this common educational workaround is now creating its own problems which will take time to fully solve.
Currently, the official definition Stats NZ uses for biological sex is binary. In the last two years, Stats NZ has tested adding a third response option using either ‘indeterminate’ or ‘intersex’. Of these tests, Stats NZ said the data was of very low quality and included facetious responses and responses made in error:
“Given the very low prevalence of the intersex population, the test results indicated that inaccurate responses for a third category would be as common as – or outnumber – legitimate responses for this category.”
If one of your students is intersex, I recommend they do not answer Question 1 for CensusAtSchool. Stats NZ advice was for people to request a paper copy of the census and then to check both boxes on the form.
Currently, gender identity is not yet asked in the official census and is not asked by CensusAtSchool. It is also not yet asked in other countries official census.
Stats NZ wrote that the reason not yet to ask gender identity is purely for statistical reasons:
“Our testing did not give us confidence we could collect quality information on these topics through the census. Writing census questions is complex and demands a great deal of expertise and testing to ensure the answers provide meaningful, high-quality data that can be used to inform decisions.”
This page is an excellent summary of the issues and the work being done in this area:
https://www.stats.govt.nz/
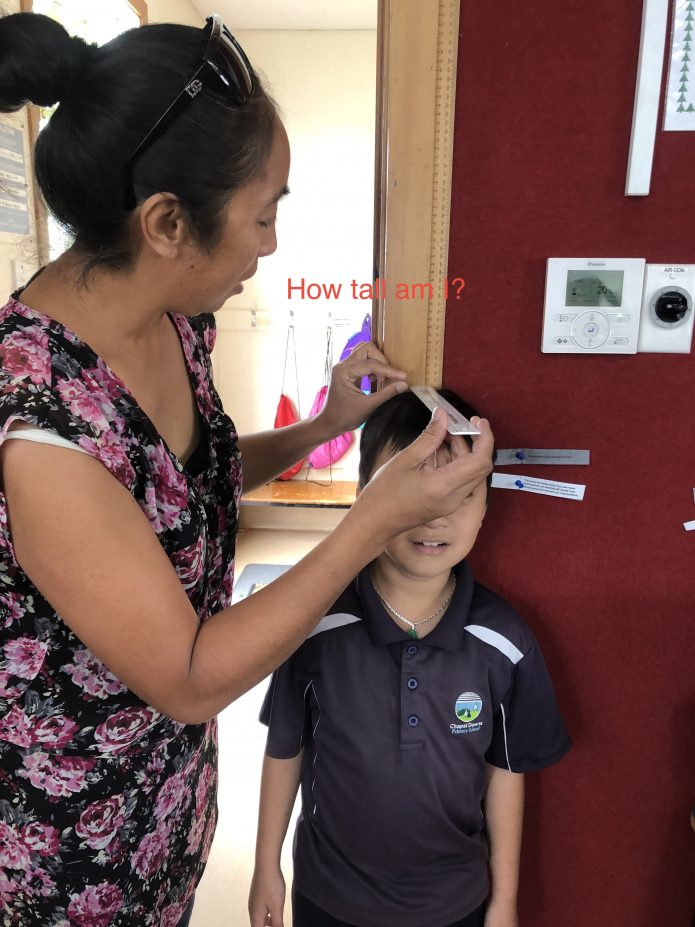
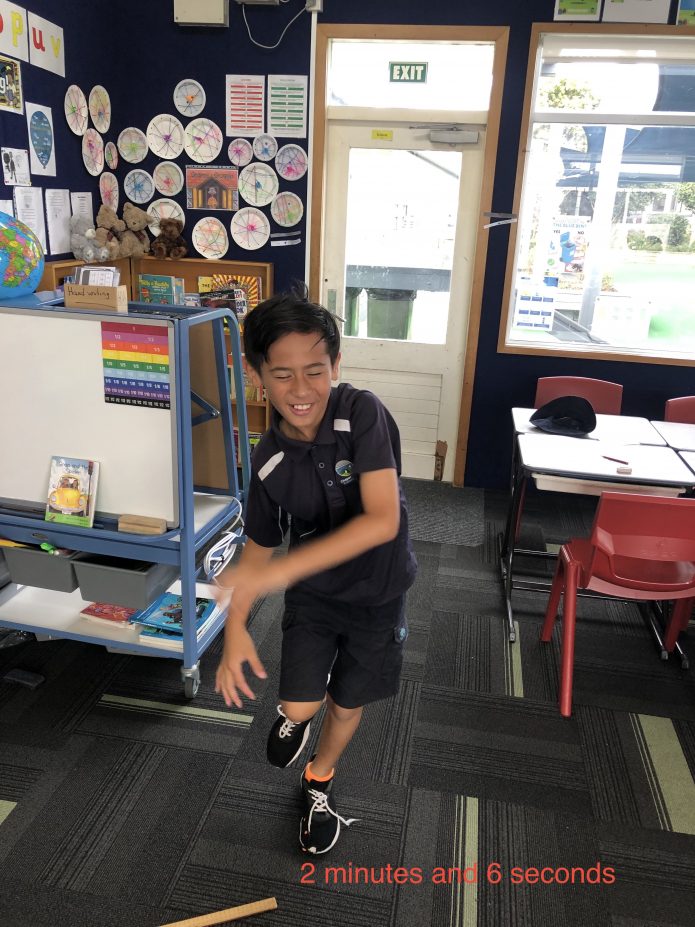
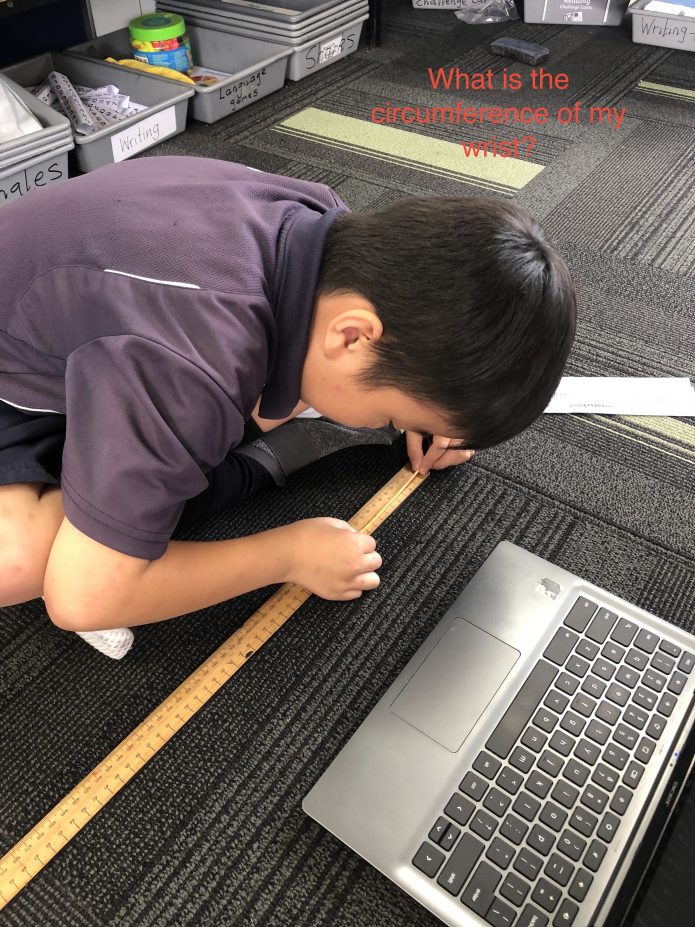
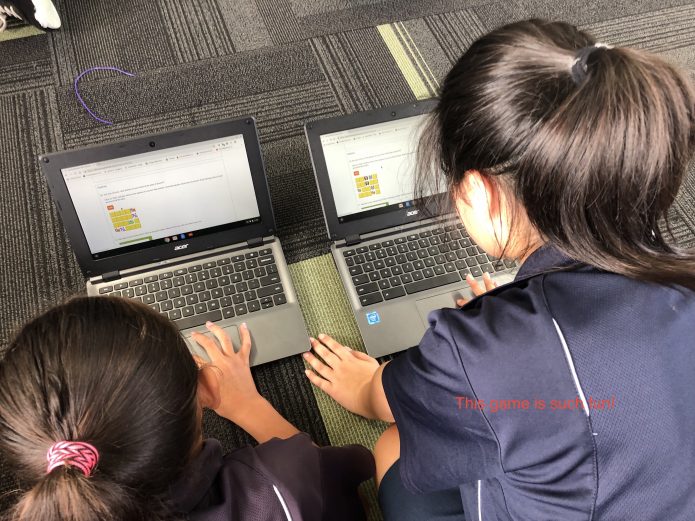
Thanks to Neil Ackermann for sharing these photos of his class at Chapel Downs Primary School taking part in CensusAtSchool.