More CensusAtSchool articles in the Howick and Pakuranga Times and the Eastern Courier. Click to enlarge.
More CensusAtSchool articles in the Howick and Pakuranga Times and the Eastern Courier. Click to enlarge.
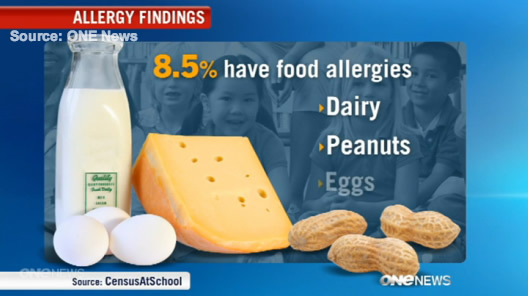
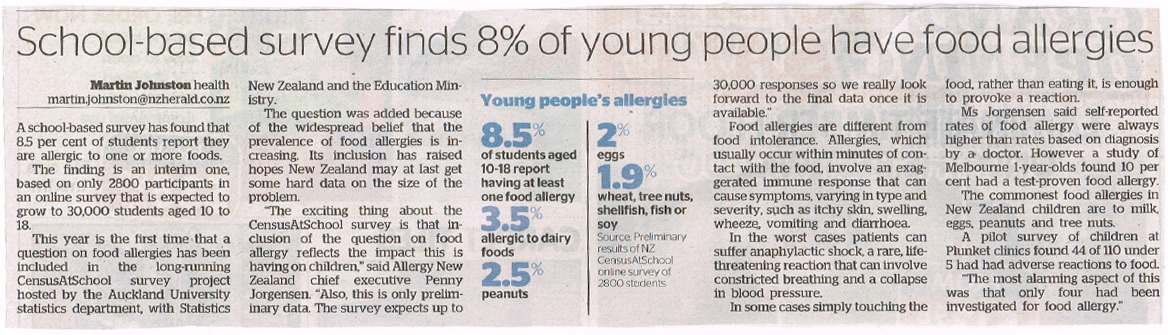
Dairy is the most common food allergy among New Zealand school children, according to early results of the nationwide CensusAtSchool project.
CensusAtSchool, which started on Monday and runs until June 15, is an online educational project that brings statistics to life in the classroom. Supervised by teachers, students answer 32 questions about their lives, many of them involving practical activities such as weighing and measuring, then analyse the results in class. This year, more than 1120 teachers from 539 schools all over New Zealand are running CAS in their classrooms.
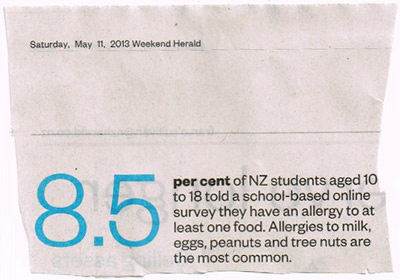
Early results, from the first 2800 respondents, show that 8.5% of students aged 10 to 18 (Year 5 to Year 13) taking part to date report having one or more food allergies. Dairy is top of the list (3.5% of all respondents), followed by peanuts (2.5%) and eggs (2.0%), then wheat, tree nuts, shellfish, fish and soy (each under 1.9%). The consequences of a food allergy can range from uncomfortable to life-threatening.
CensusAtSchool co-director Rachel Cunliffe says a question about food allergies was added to this year’s questionnaire for the first time to reflect the lack of data on the issue. “There appears to be plenty of anecdotal evidence that this generation of children is more allergy-prone than earlier generations,” she says, “and we were keen to see what food allergies students reported and their prevalence.”
She adds, “While these are self-reported allergy figures, which may have a range of meanings and differ in their severity, the figures provide an interesting snapshot of what food allergies students have to manage.”
CensusAtSchool, now in its sixth edition, is a biennial collaborative project involving teachers, the University of Auckland’s Department of Statistics, Statistics New Zealand and the Ministry of Education. It is part of an international effort to boost statistical capability among young people, and is carried out in Australia, the United Kingdom, Canada, the US, Japan and South Africa. The countries share some questions so comparisons can be made, but the majority reflect New Zealand students’ interests
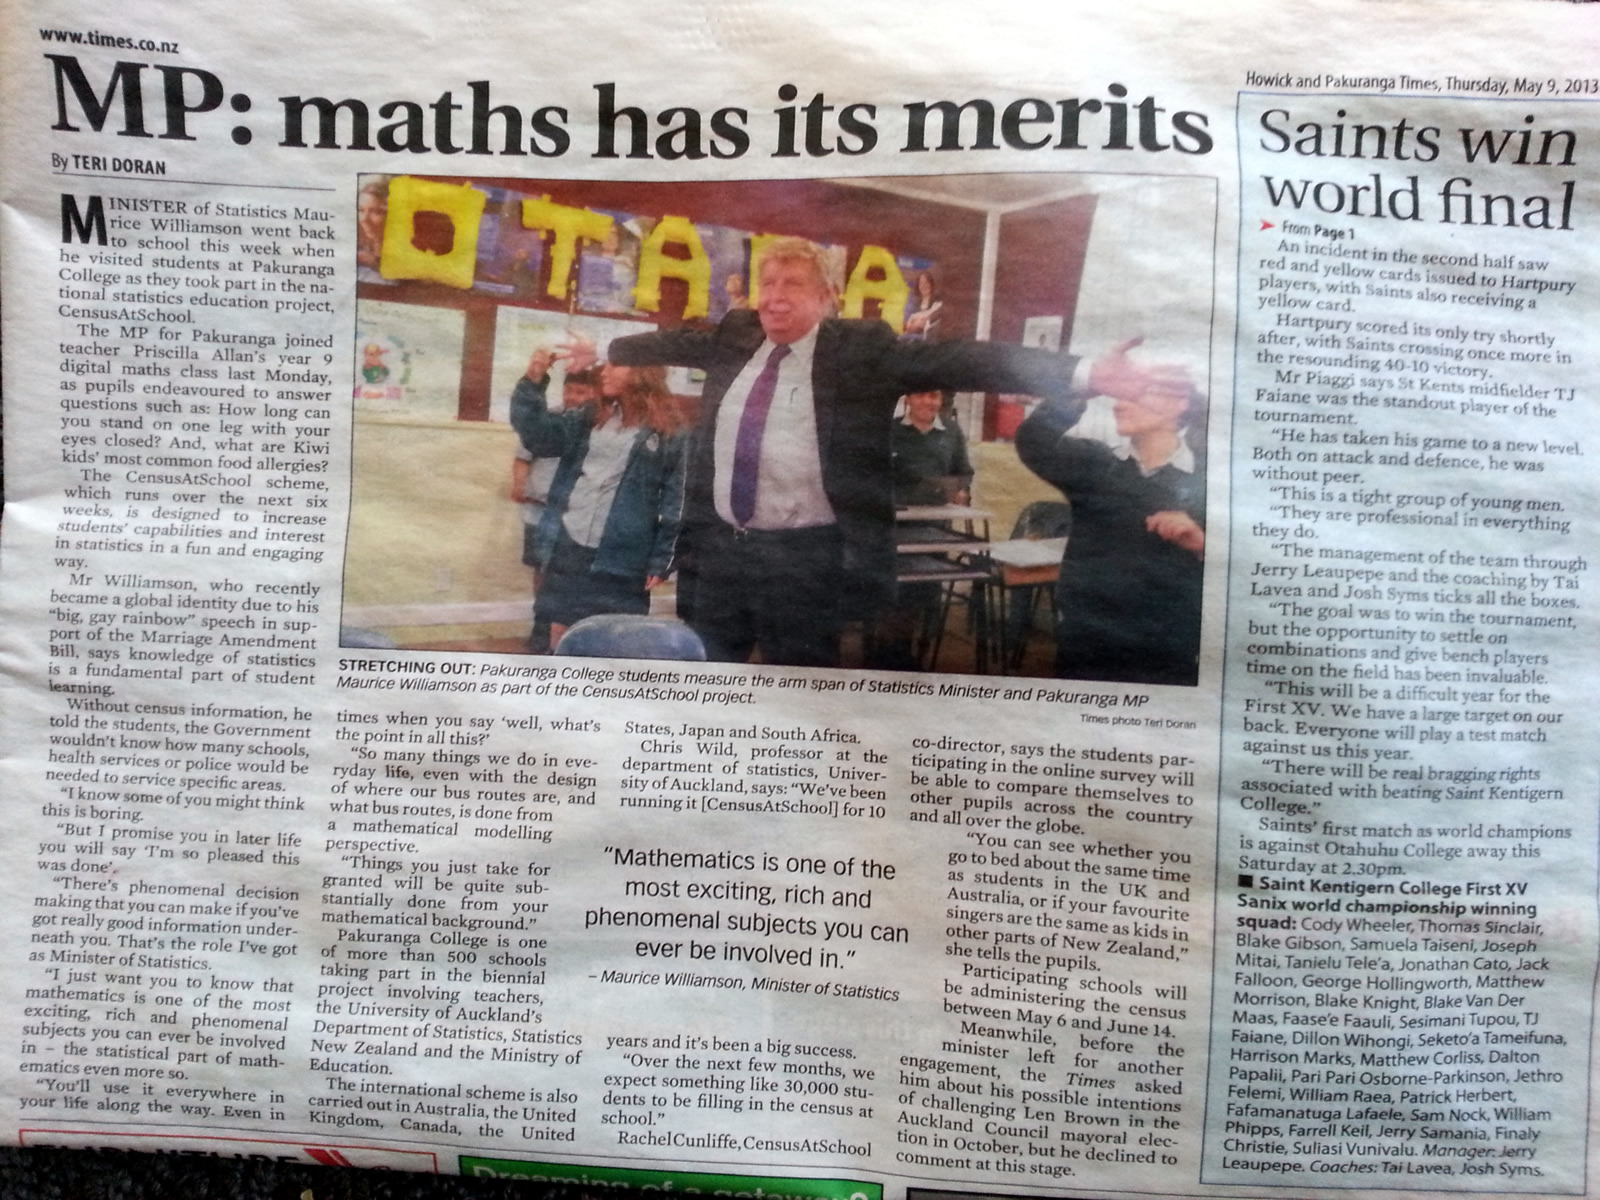
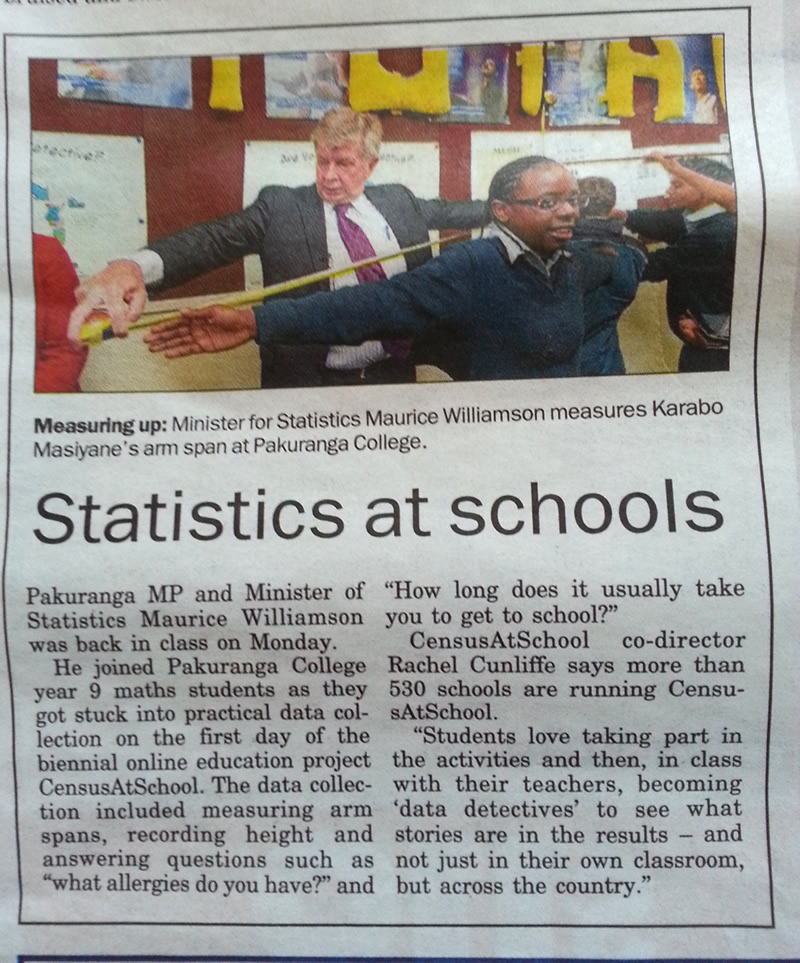
Pakuranga MP and Minister of Statistics Maurice Williamson joined Pakuranga College Year 9 maths students on Monday, May 6 as they got stuck into practical data collection on the first day of the biennial, online educational project CensusAtSchool. The data collection included measuring arm spans, recording height and answering questions such as “what allergies do you have?” and “How long does it usually take you to get to school?”
CensusAtSchool co-director Rachel Cunliffe says more than 530 schools, representing 1102 teachers are running CensusAtSchool in their maths and statistics classes until June 15, after which the data is released for classroom analysis. “Students love taking part in the activities and then, in class with their teachers, becoming “data detectives” to see what stories are in the results – and not just in their own classroom, but across the country.”
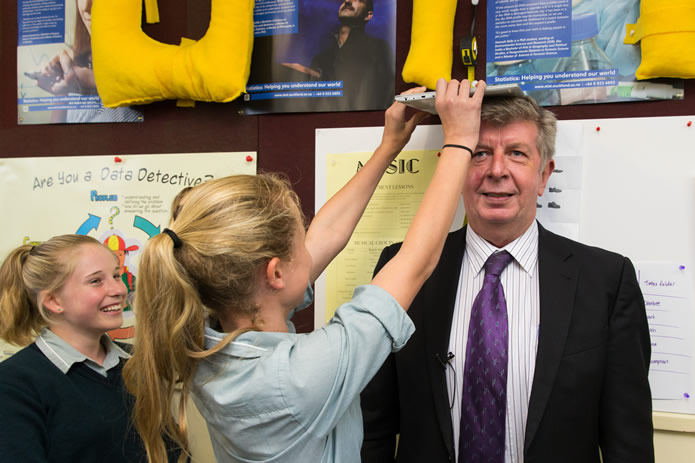
Photo: Stephen Barker, www.barkerphotography.co.nz. ©The University of Auckland.
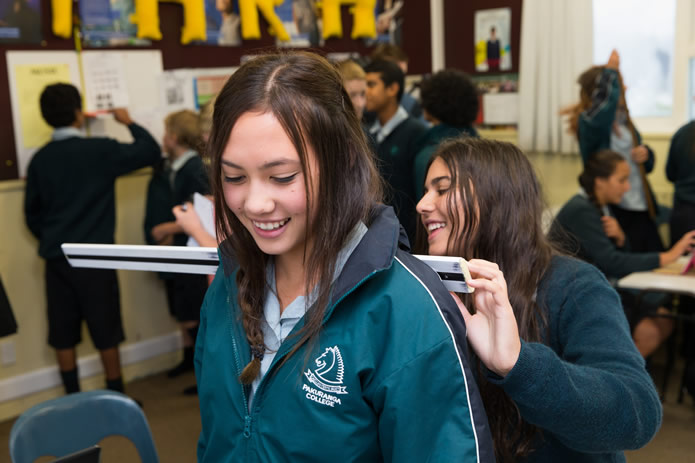
Photo: Stephen Barker, www.barkerphotography.co.nz. ©The University of Auckland.
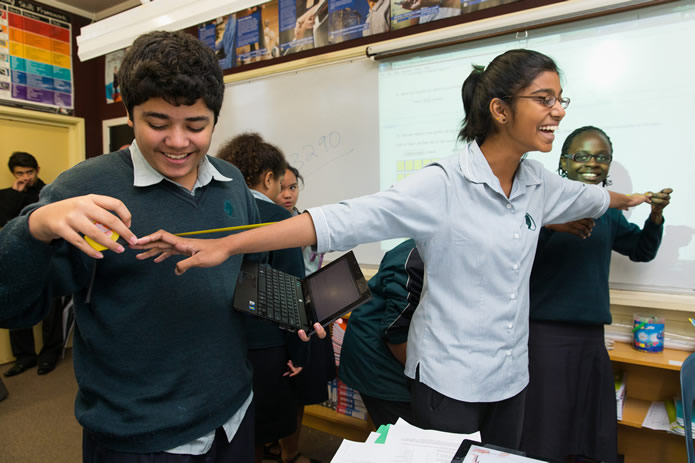
Photo: Stephen Barker, www.barkerphotography.co.nz. ©The University of Auckland.
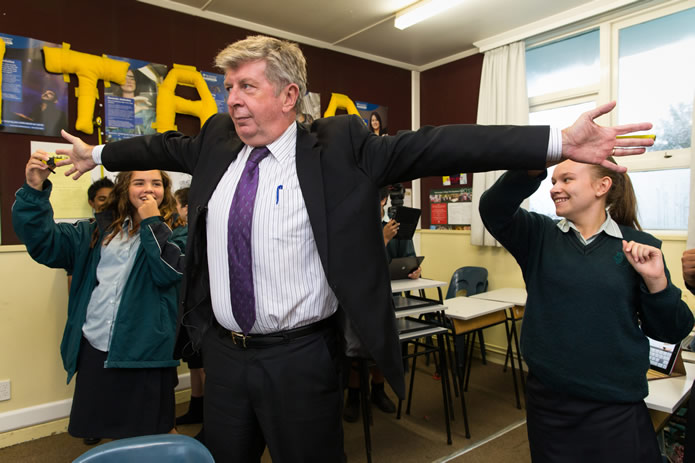
Photo: Stephen Barker, www.barkerphotography.co.nz. ©The University of Auckland.
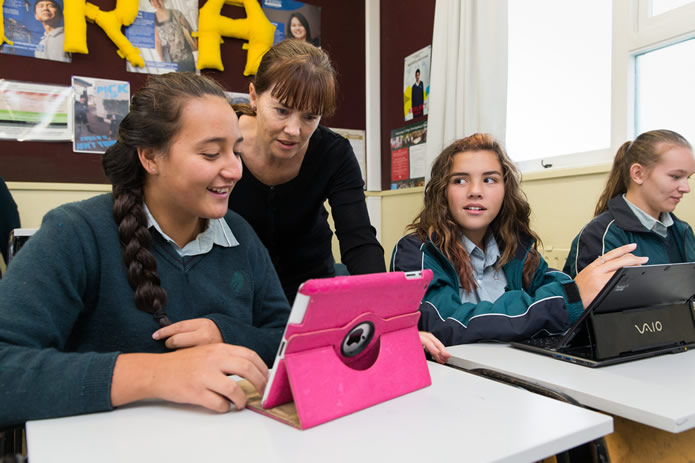
Photo: Stephen Barker, www.barkerphotography.co.nz. ©The University of Auckland.
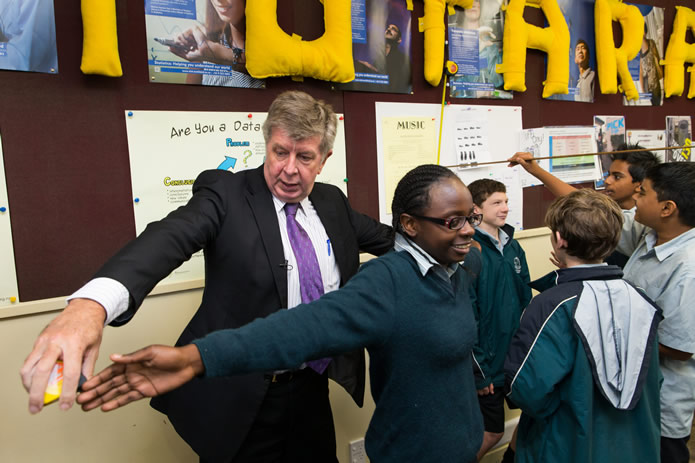
Photo: Stephen Barker, www.barkerphotography.co.nz. ©The University of Auckland.
Campbell Live filmed Maurice Williamson in the classroom as a part of their story. You can watch the clip here.
Full sized versions of these photographs and others are available for free for media use. Please contact us.
The Wairarapa Times Age and Marlborough Express have run stories today about CensusAtSchool.
What are Kiwi kids’ most common food allergies? What time do they go to sleep at night? How long can they stand on their left leg with their eyes closed?
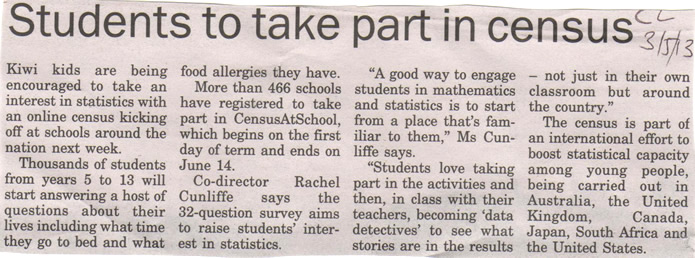
Thousands of students aged between 10 and 18 (Year 5 to Year 13) are due to start answering these questions – and a host of others about their lives – when the online CensusAtSchool 2013 begins on Monday, May 6, the first day of the new term.
So far, 466 schools have registered to take part. Co-director Rachel Cunliffe says that teachers will administer the census in class between May 6 and June 14. The 32-question survey, available in English and Māori, aims to raise students’ interest in statistics and provide a fascinating picture of what they are thinking, feeling and doing.
“A good way to engage students in mathematics and statistics is to start from a place that’s familiar to them – their own lives and the lives of their friends,” says Cunliffe, a University of Auckland-trained statistician and owner of several internet enterprises. “Students love taking part in the activities and then, in class with their teachers, becoming “data detectives” to see what stories are in the results – and not just in their own classroom, but across the country.”
Students are being asked for the first time about food allergies to reflect the lack of data on the issue, says Cunliffe. “Students will be able to explore the dataset to compare the prevalence of self-reported allergies for different ages, ethnicities and sexes.”
CensusAtSchool, now in its sixth edition, is a biennual collaborative project involving teachers, the University of Auckland’s Department of Statistics, Statistics New Zealand and the Ministry of Education. It is part of an international effort to boost statistical capability among young people, and is carried out in Australia, the United Kingdom, Canada, the US, Japan and South Africa.
Andrew Tideswell, manager of the Statistics New Zealand Education Team, says our statistics curriculum is world-leading, and CensusAtSchool helps teachers and students get the most out of it. “By engaging in CensusAtSchool, students have an experience that mirrors the structure of the national census, and it encourages them to think about the need for information and ways we might use it to solve problems,” he says. “Students develop the statistical literacy they need if New Zealand is to be an effective democracy where citizens can use statistics to make informed decisions.”
Westlake Girls High School maths teacher Dru Rose is planning for about 800 Year 9 and 10 students to take part. She’s keen to see the data that will emerge from questions about how many hours of homework students did the night before and how many hours sleep they had. “It’s real-life stuff,” she says. “We’ll be able to examine the data and see if there are any links.”
Tuesday, March 5th is the official NZ census.
The census is the official count of how many people and dwellings there are in New Zealand. It takes a snapshot of the people in New Zealand and the places wehre we live. The last census was held in 2006. Census information is needed for planning vital public services such as education, health, housing and transport. It is also used to help understand how our society changes over time.
By law everyone in New Zealand on census day must fill in a census form for the dwelling in which they are staying that evening. Check that your students know this and go home and remind their family members to fill in the form. Alternatively, they can complete their census forms online at http://www.census.govt.nz/
Statistics New Zealand
Statistics New Zealand is New Zealand’s national statistical office, collecting and publishing information the country needs to grow and prosper for nearly 120 years. You can find lots of information about New Zealand and New Zealander’s on the Statistics New Zealand website (www.stats.govt.nz), including information about businesses, population, health, and employment.
There are resources available for teachers and students at www.stats.govt.nz/schoolscorner, including the new game, Tere counts the country.
‘Tere the Tui: Tere counts the country’ is a new, free learning game, designed by Statistics New Zealand to help familiarise children with New Zealand statistics as well as statistical terms.
Players answer multi-choice questions about each region of New Zealand, finding answers in the tool Interactive Boundary Maps.
When players have correctly answered a question about each region they can choose to go in the draw to win one of 200 Census branded USB sticks.
Tere counts the country can be played by children in the classroom or at home.
2013 is the International Year of Statistics, a worldwide event supported by nearly 1,700 organizations!
The founding organizations of the International Year of Statistics—also called Statistics2013—are the American Statistical Association, Institute of Mathematical Statistics, International Biometric Society, International Statistical Institute (and the Bernoulli Society), and Royal Statistical Society. As established by the founding organizations, the campaign’s primary objectives are to do the following:
Visit the website, Statistics2013 and promote Statistics as a tool for life (and possibly a career option!).
A number of data sets are now available in csv format for you to use with your class when investigating time series data at NZ Curriculum Level 8 (or AS 3.8).
Data sets include: NZ Alcohol consumption, Births, Rainfall, Travel and Tourism, Accomodation, Air Passengers and temperatures around the world.
Click here to go to the resource: Time series data sets 2013, Time series data sets 2012, and iNZight instructions for time series.