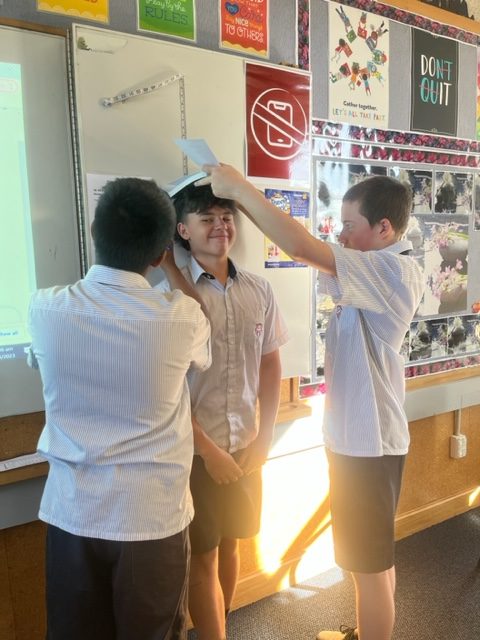
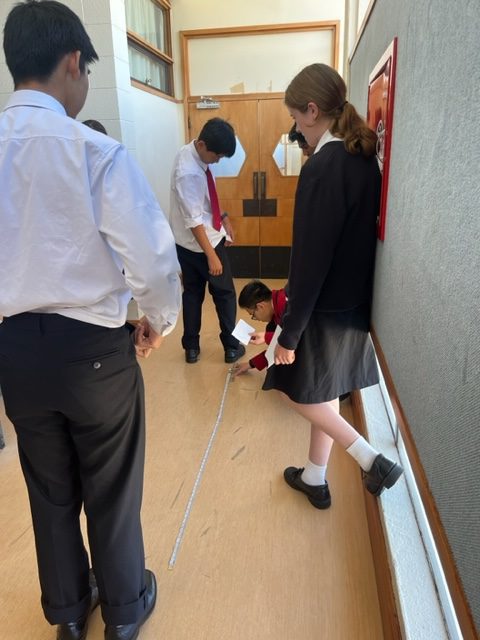
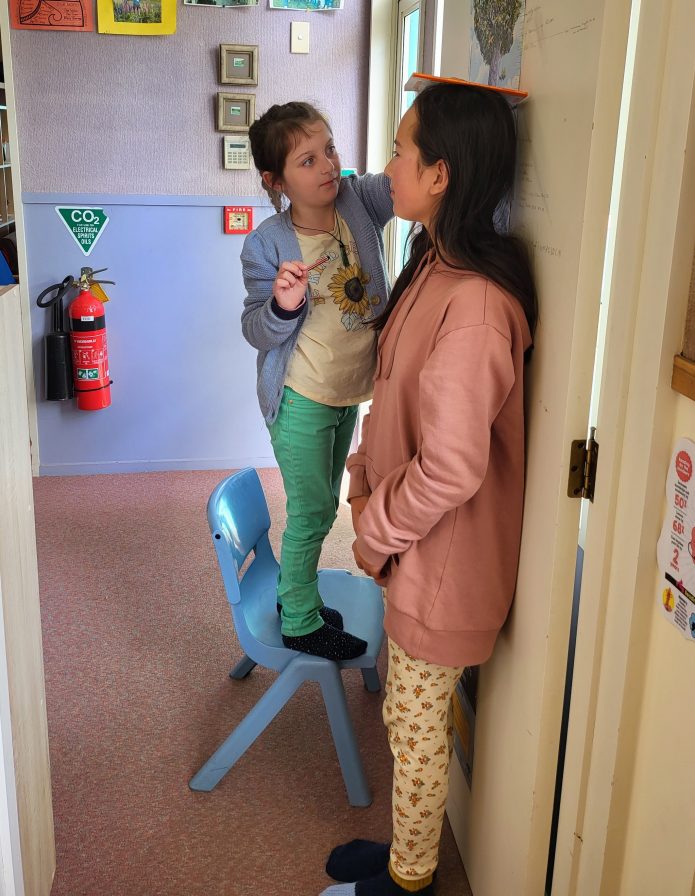
Thanks to Nicole Higby for sending these photos of students at Marian Catholic School taking part in CensusAtSchool!
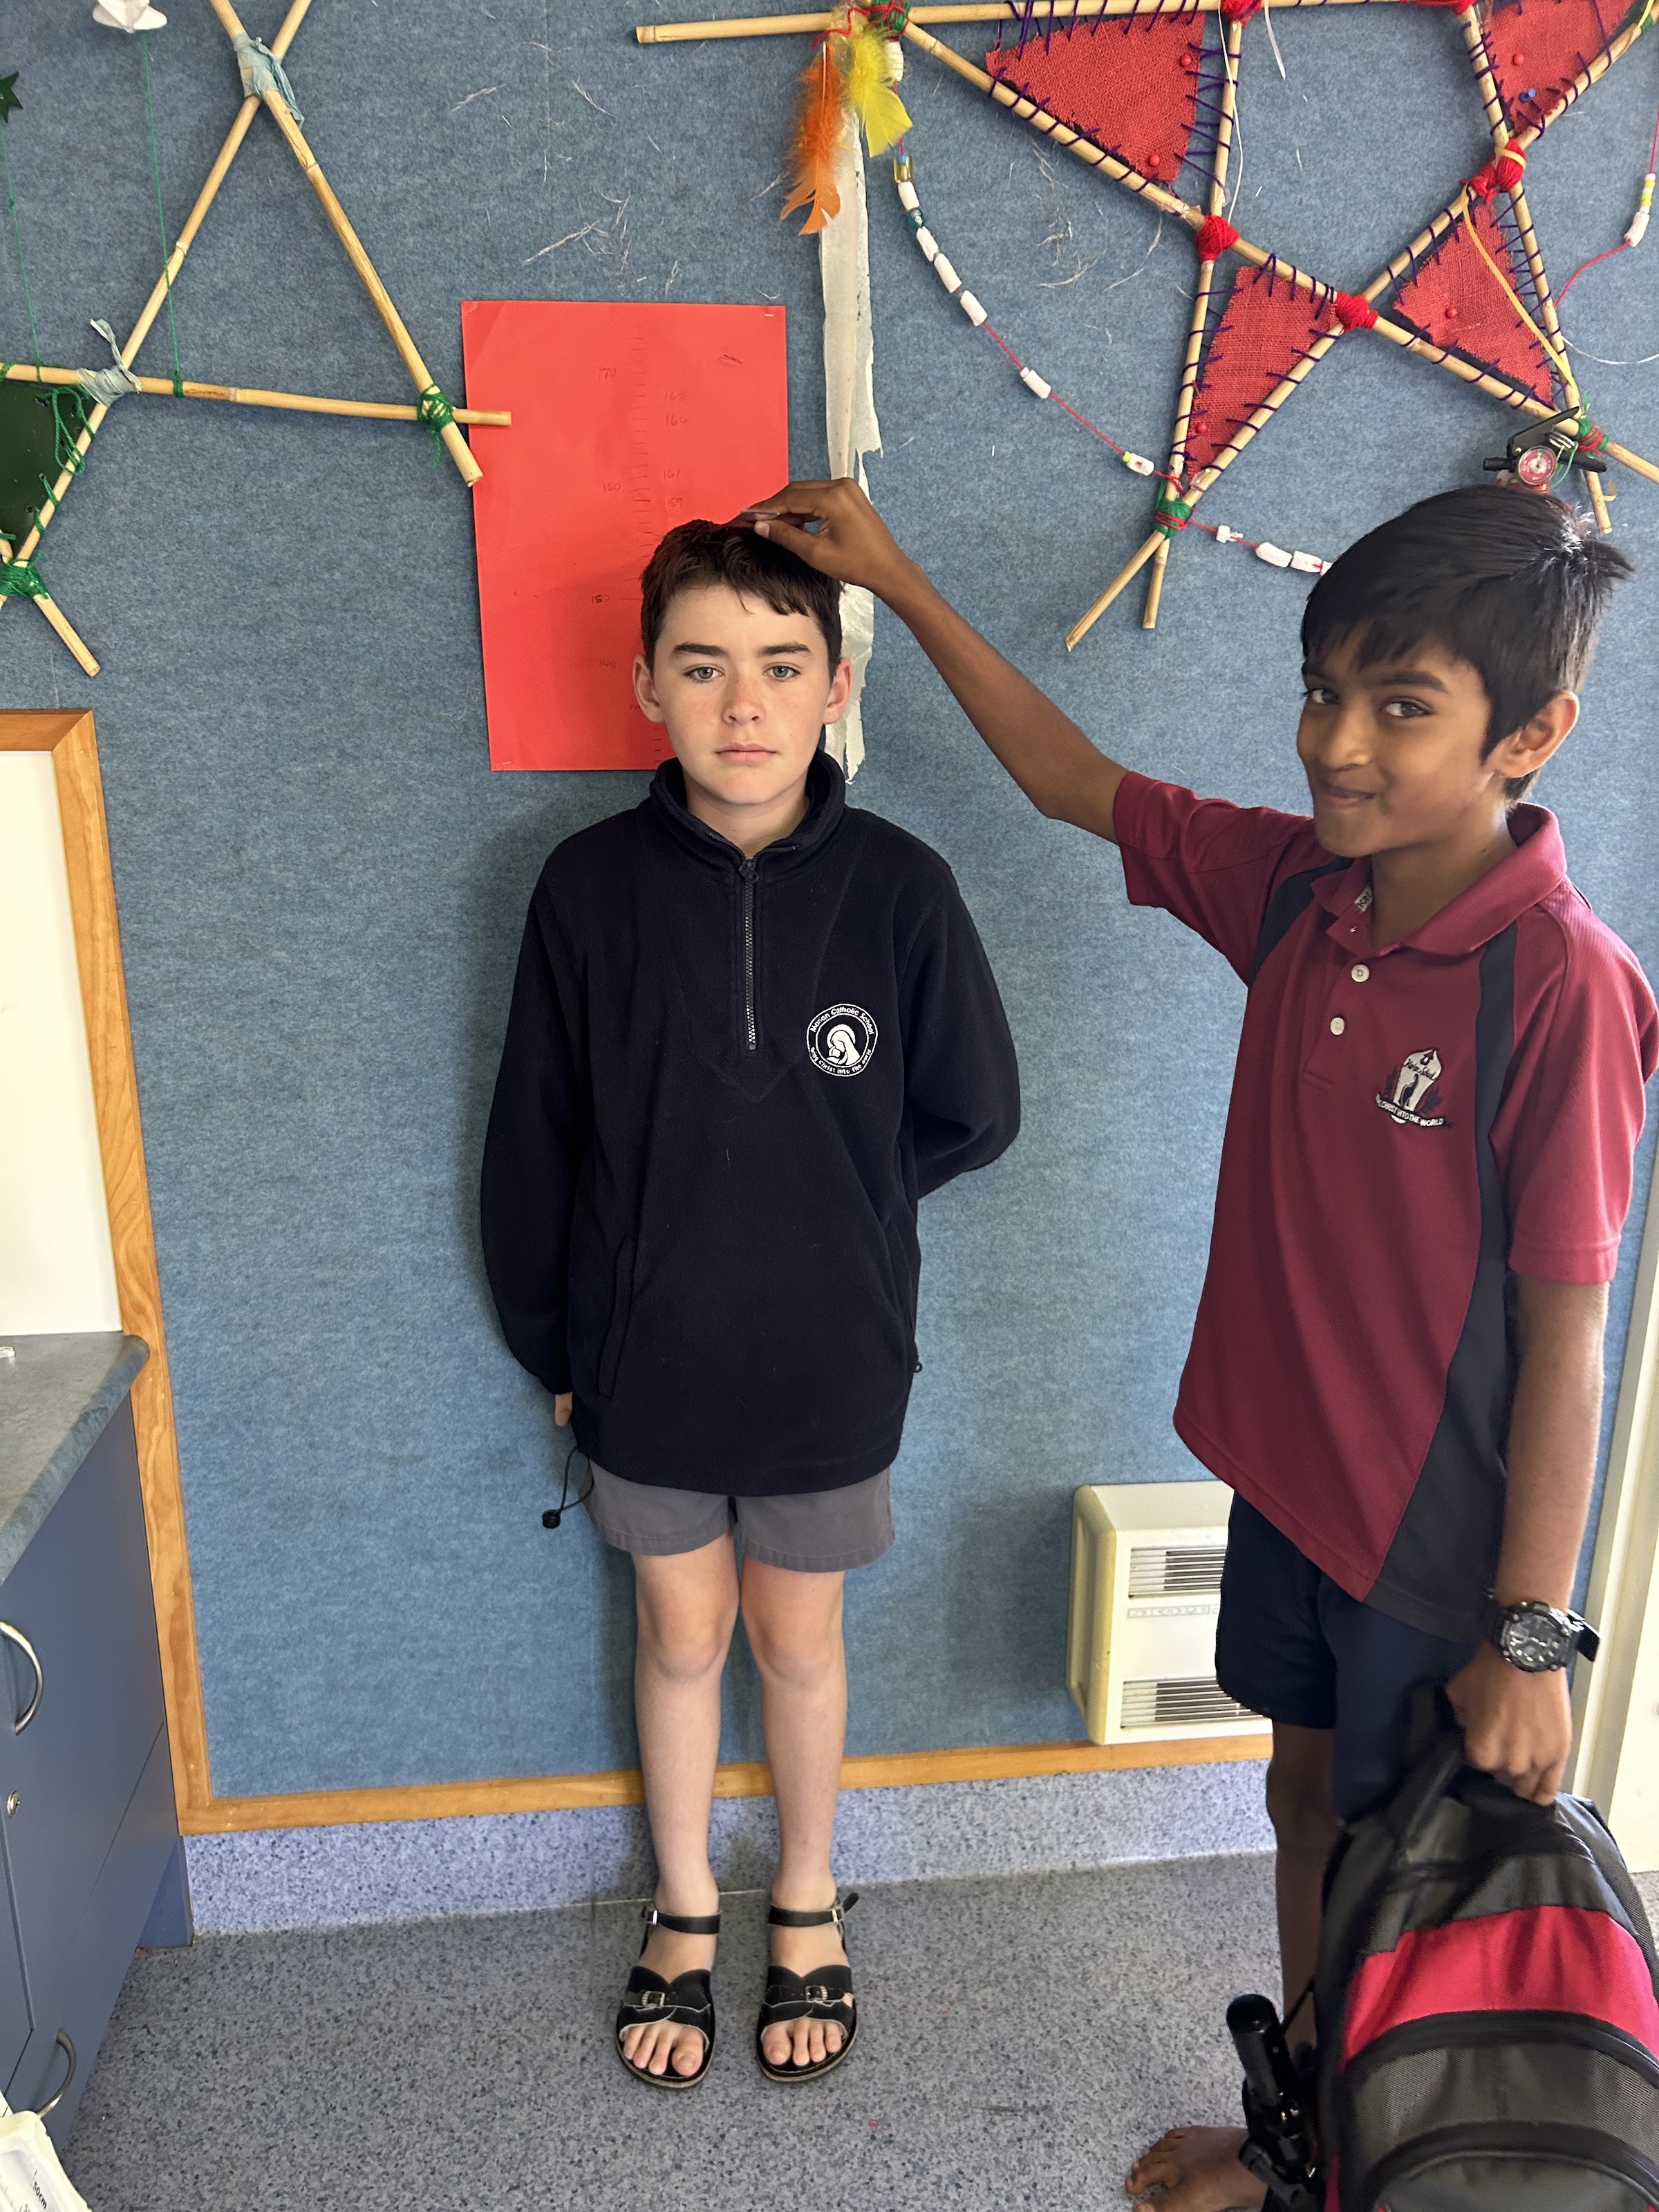
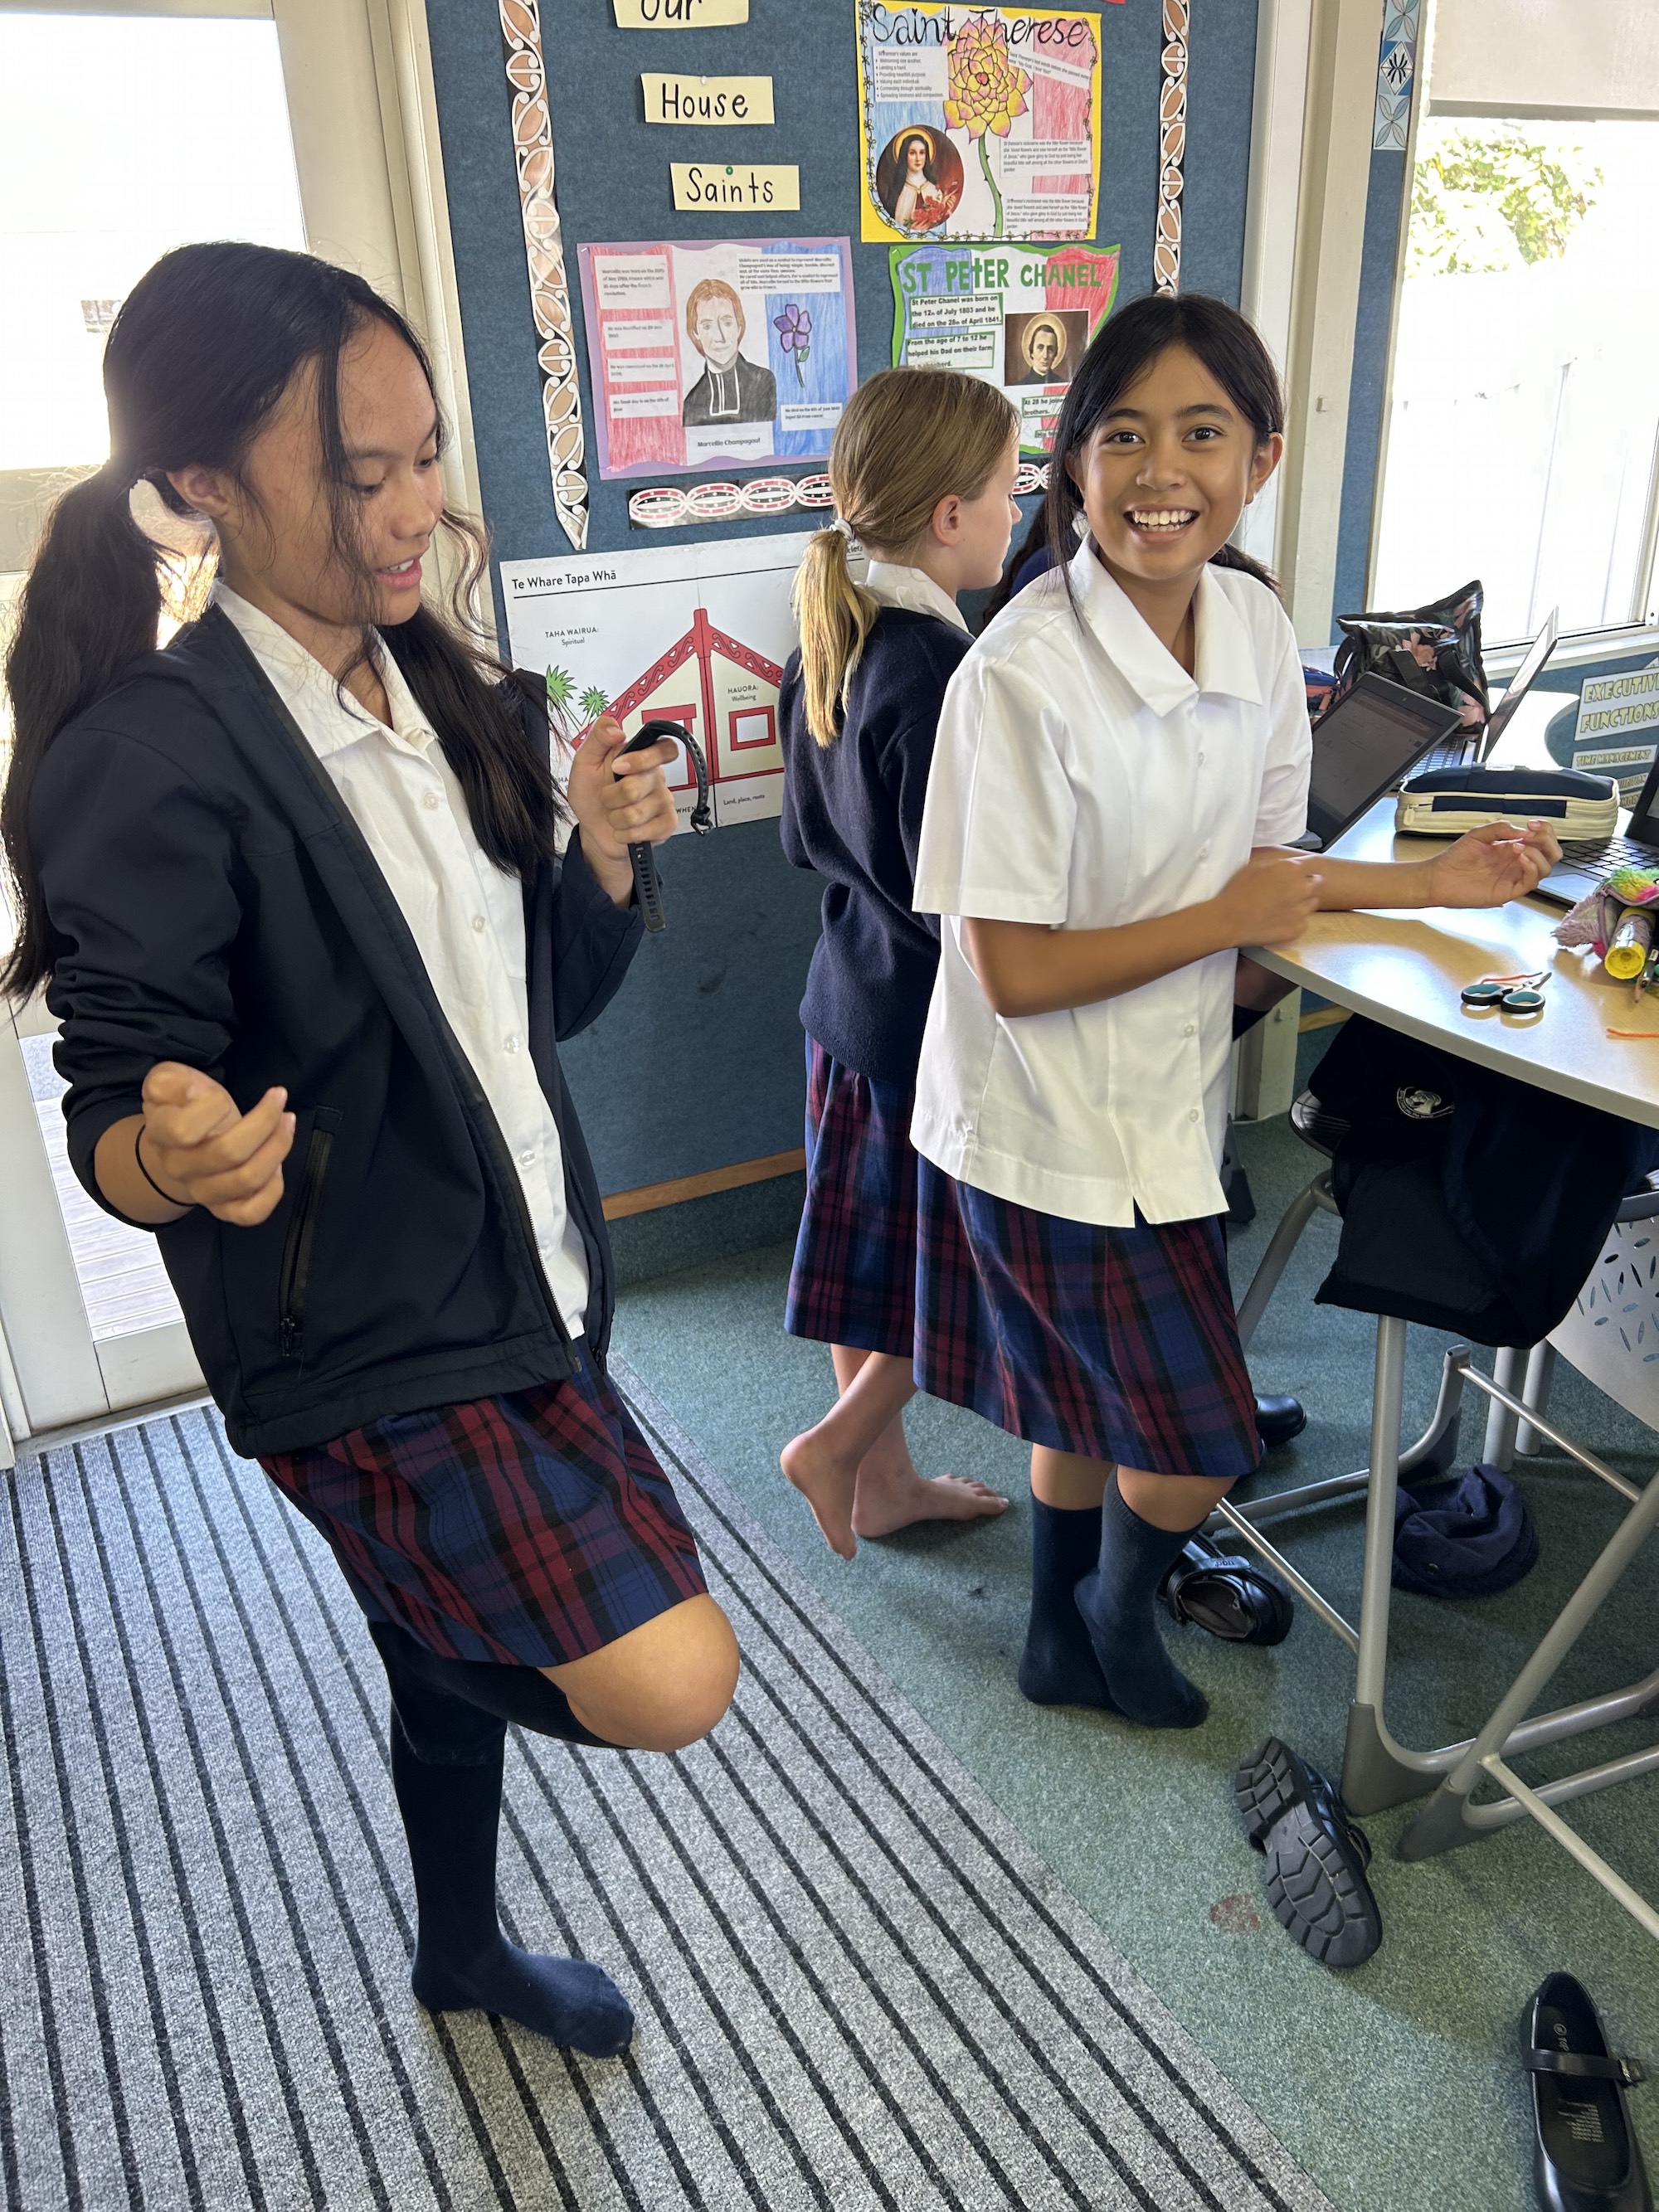
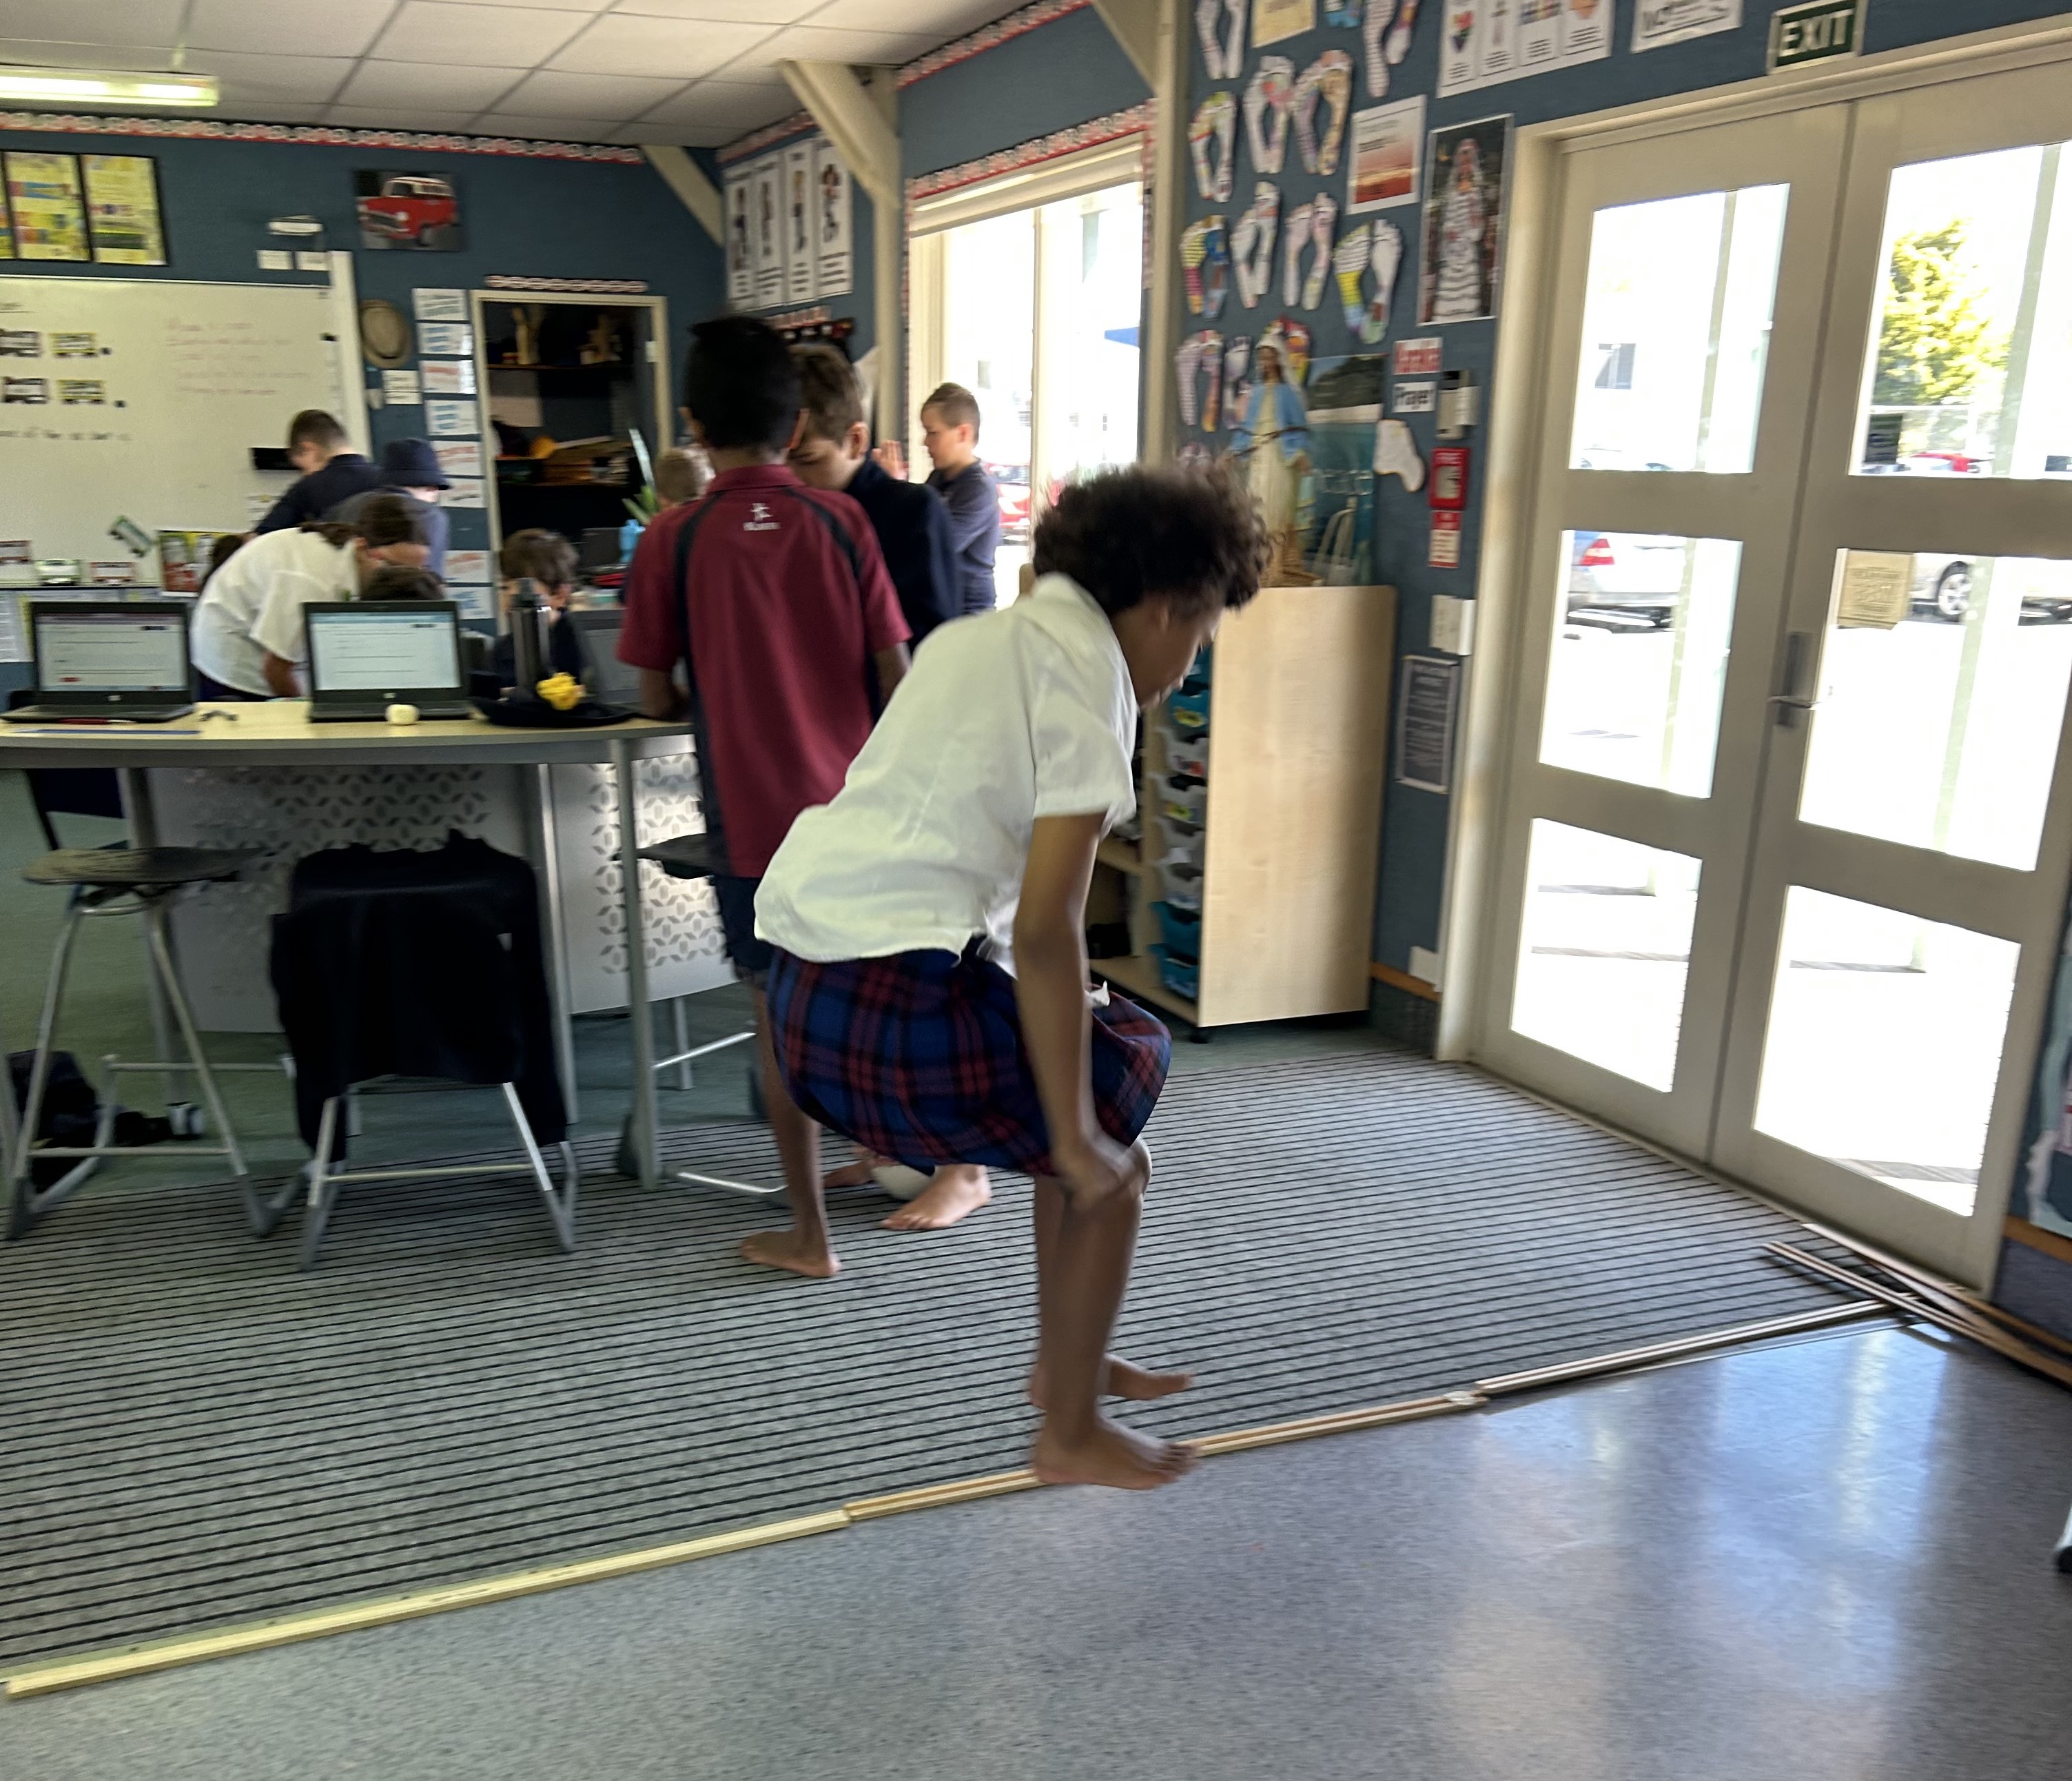
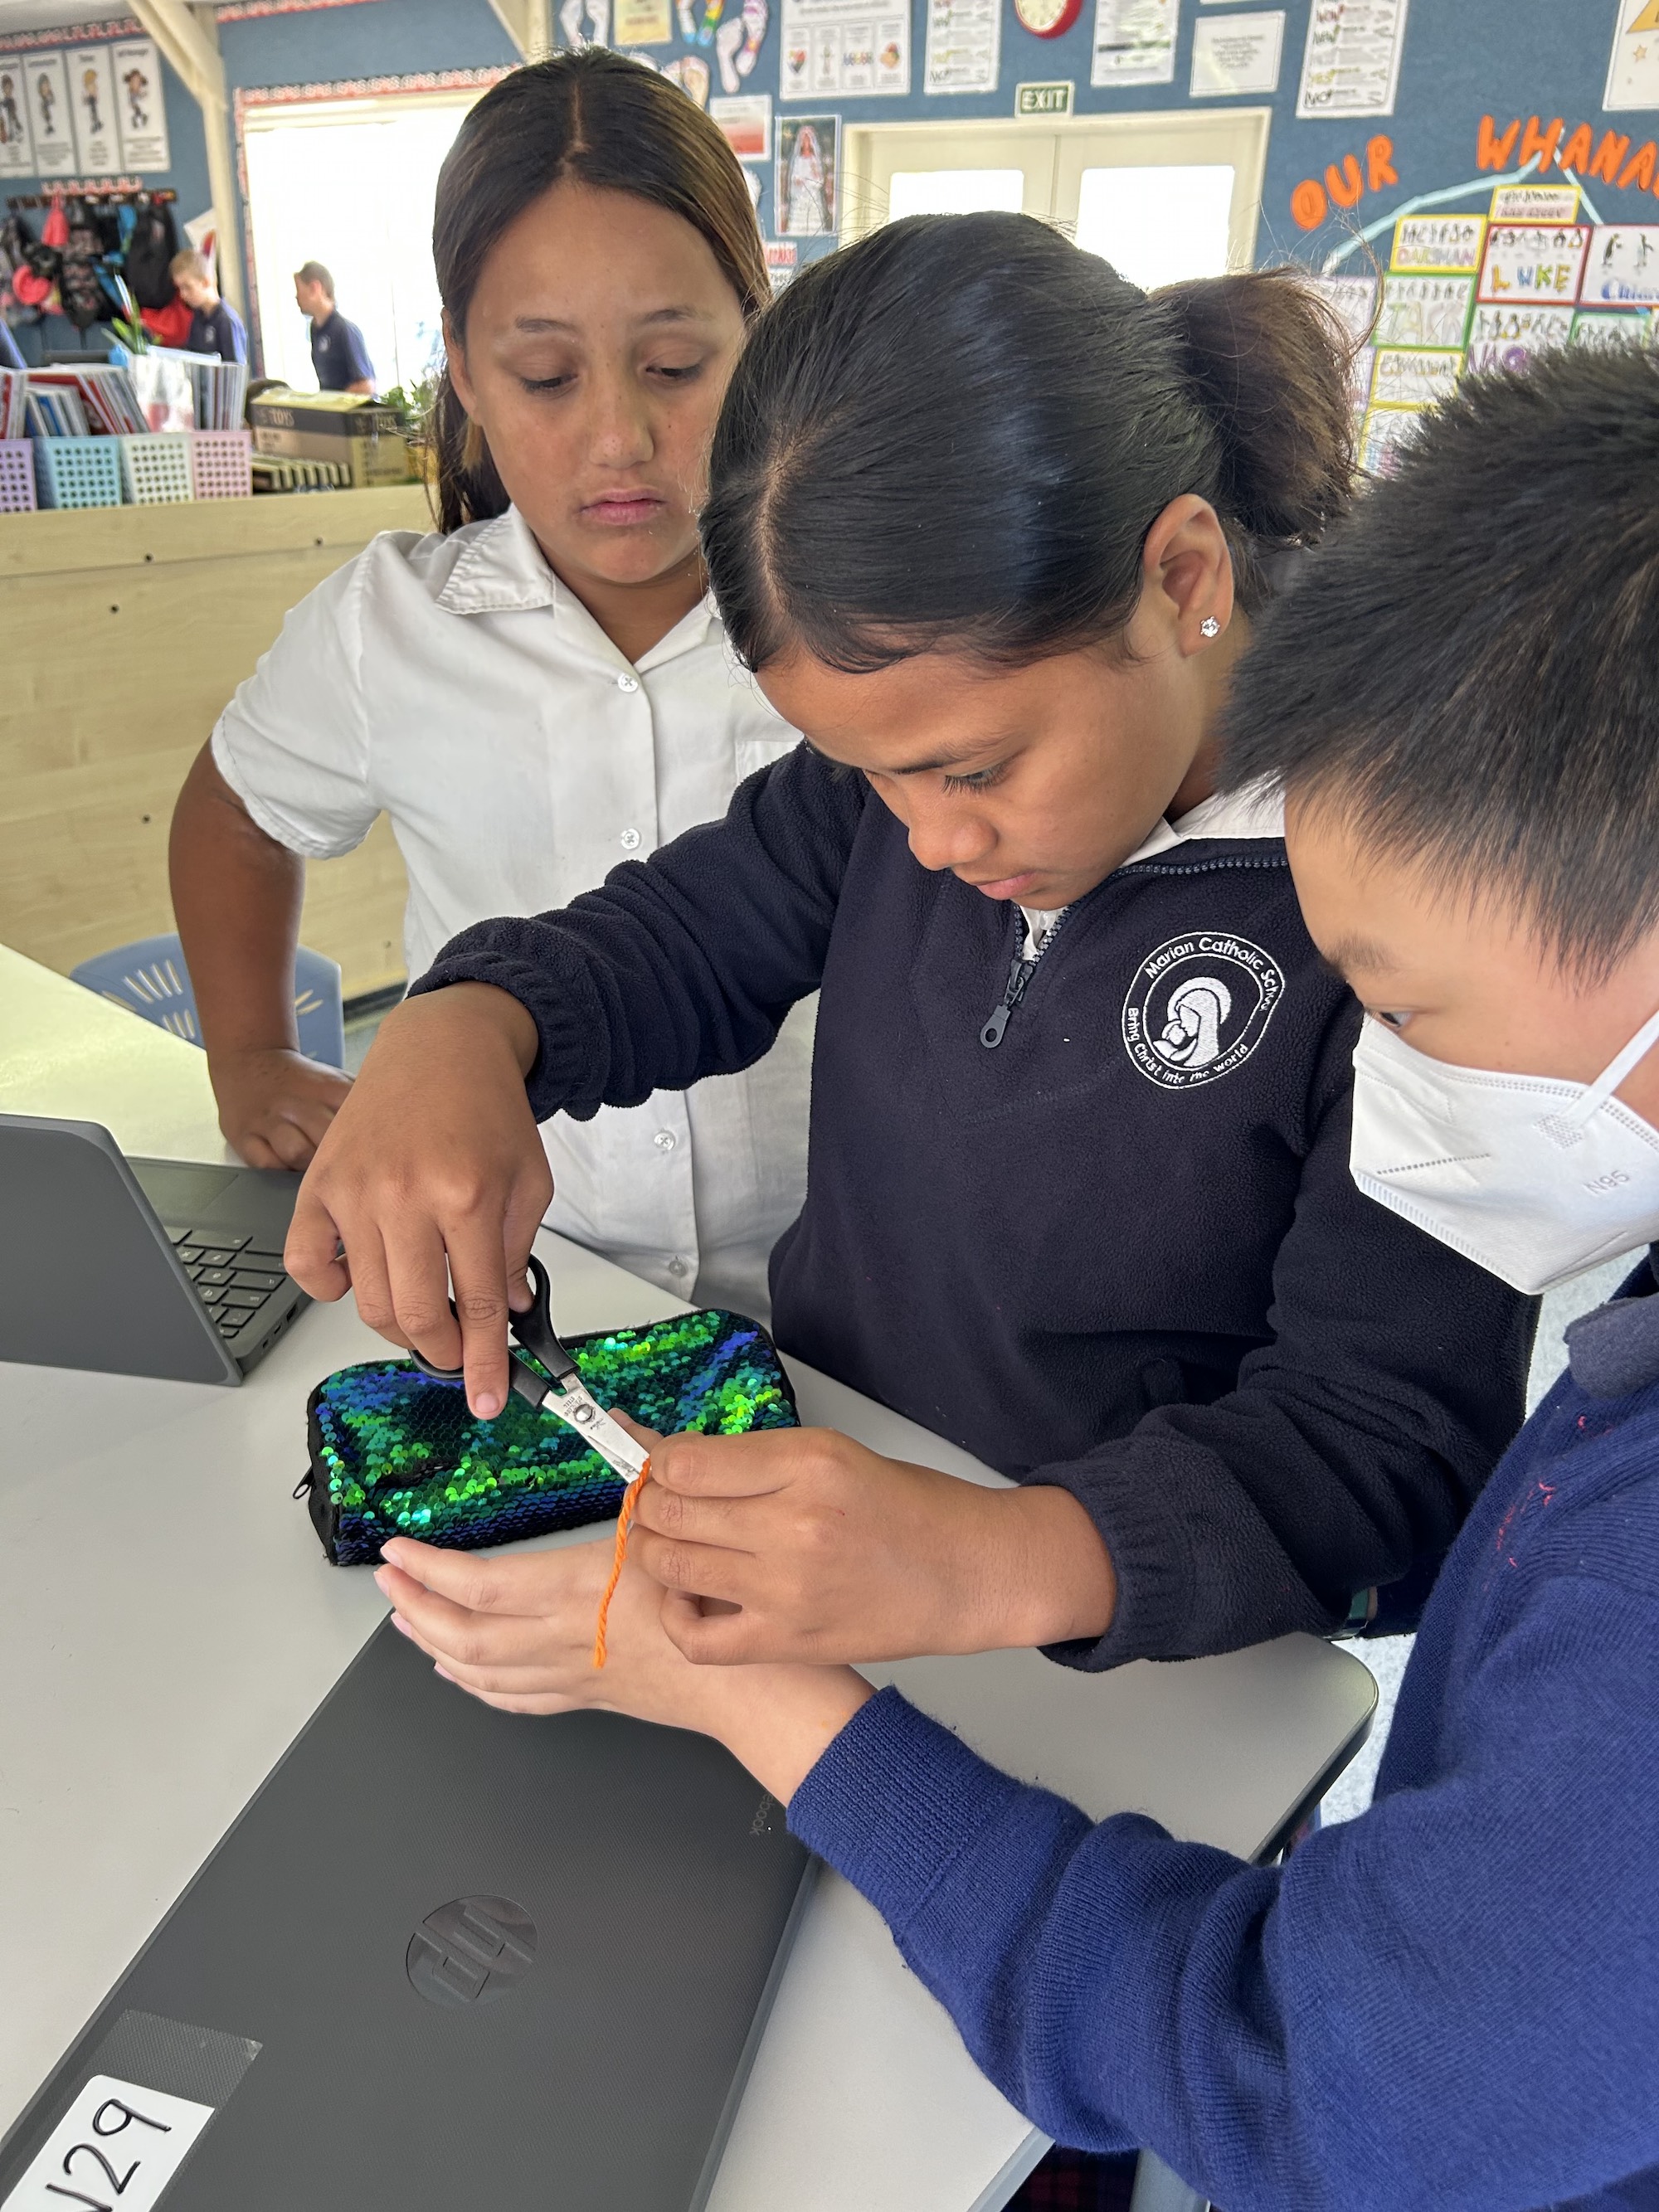
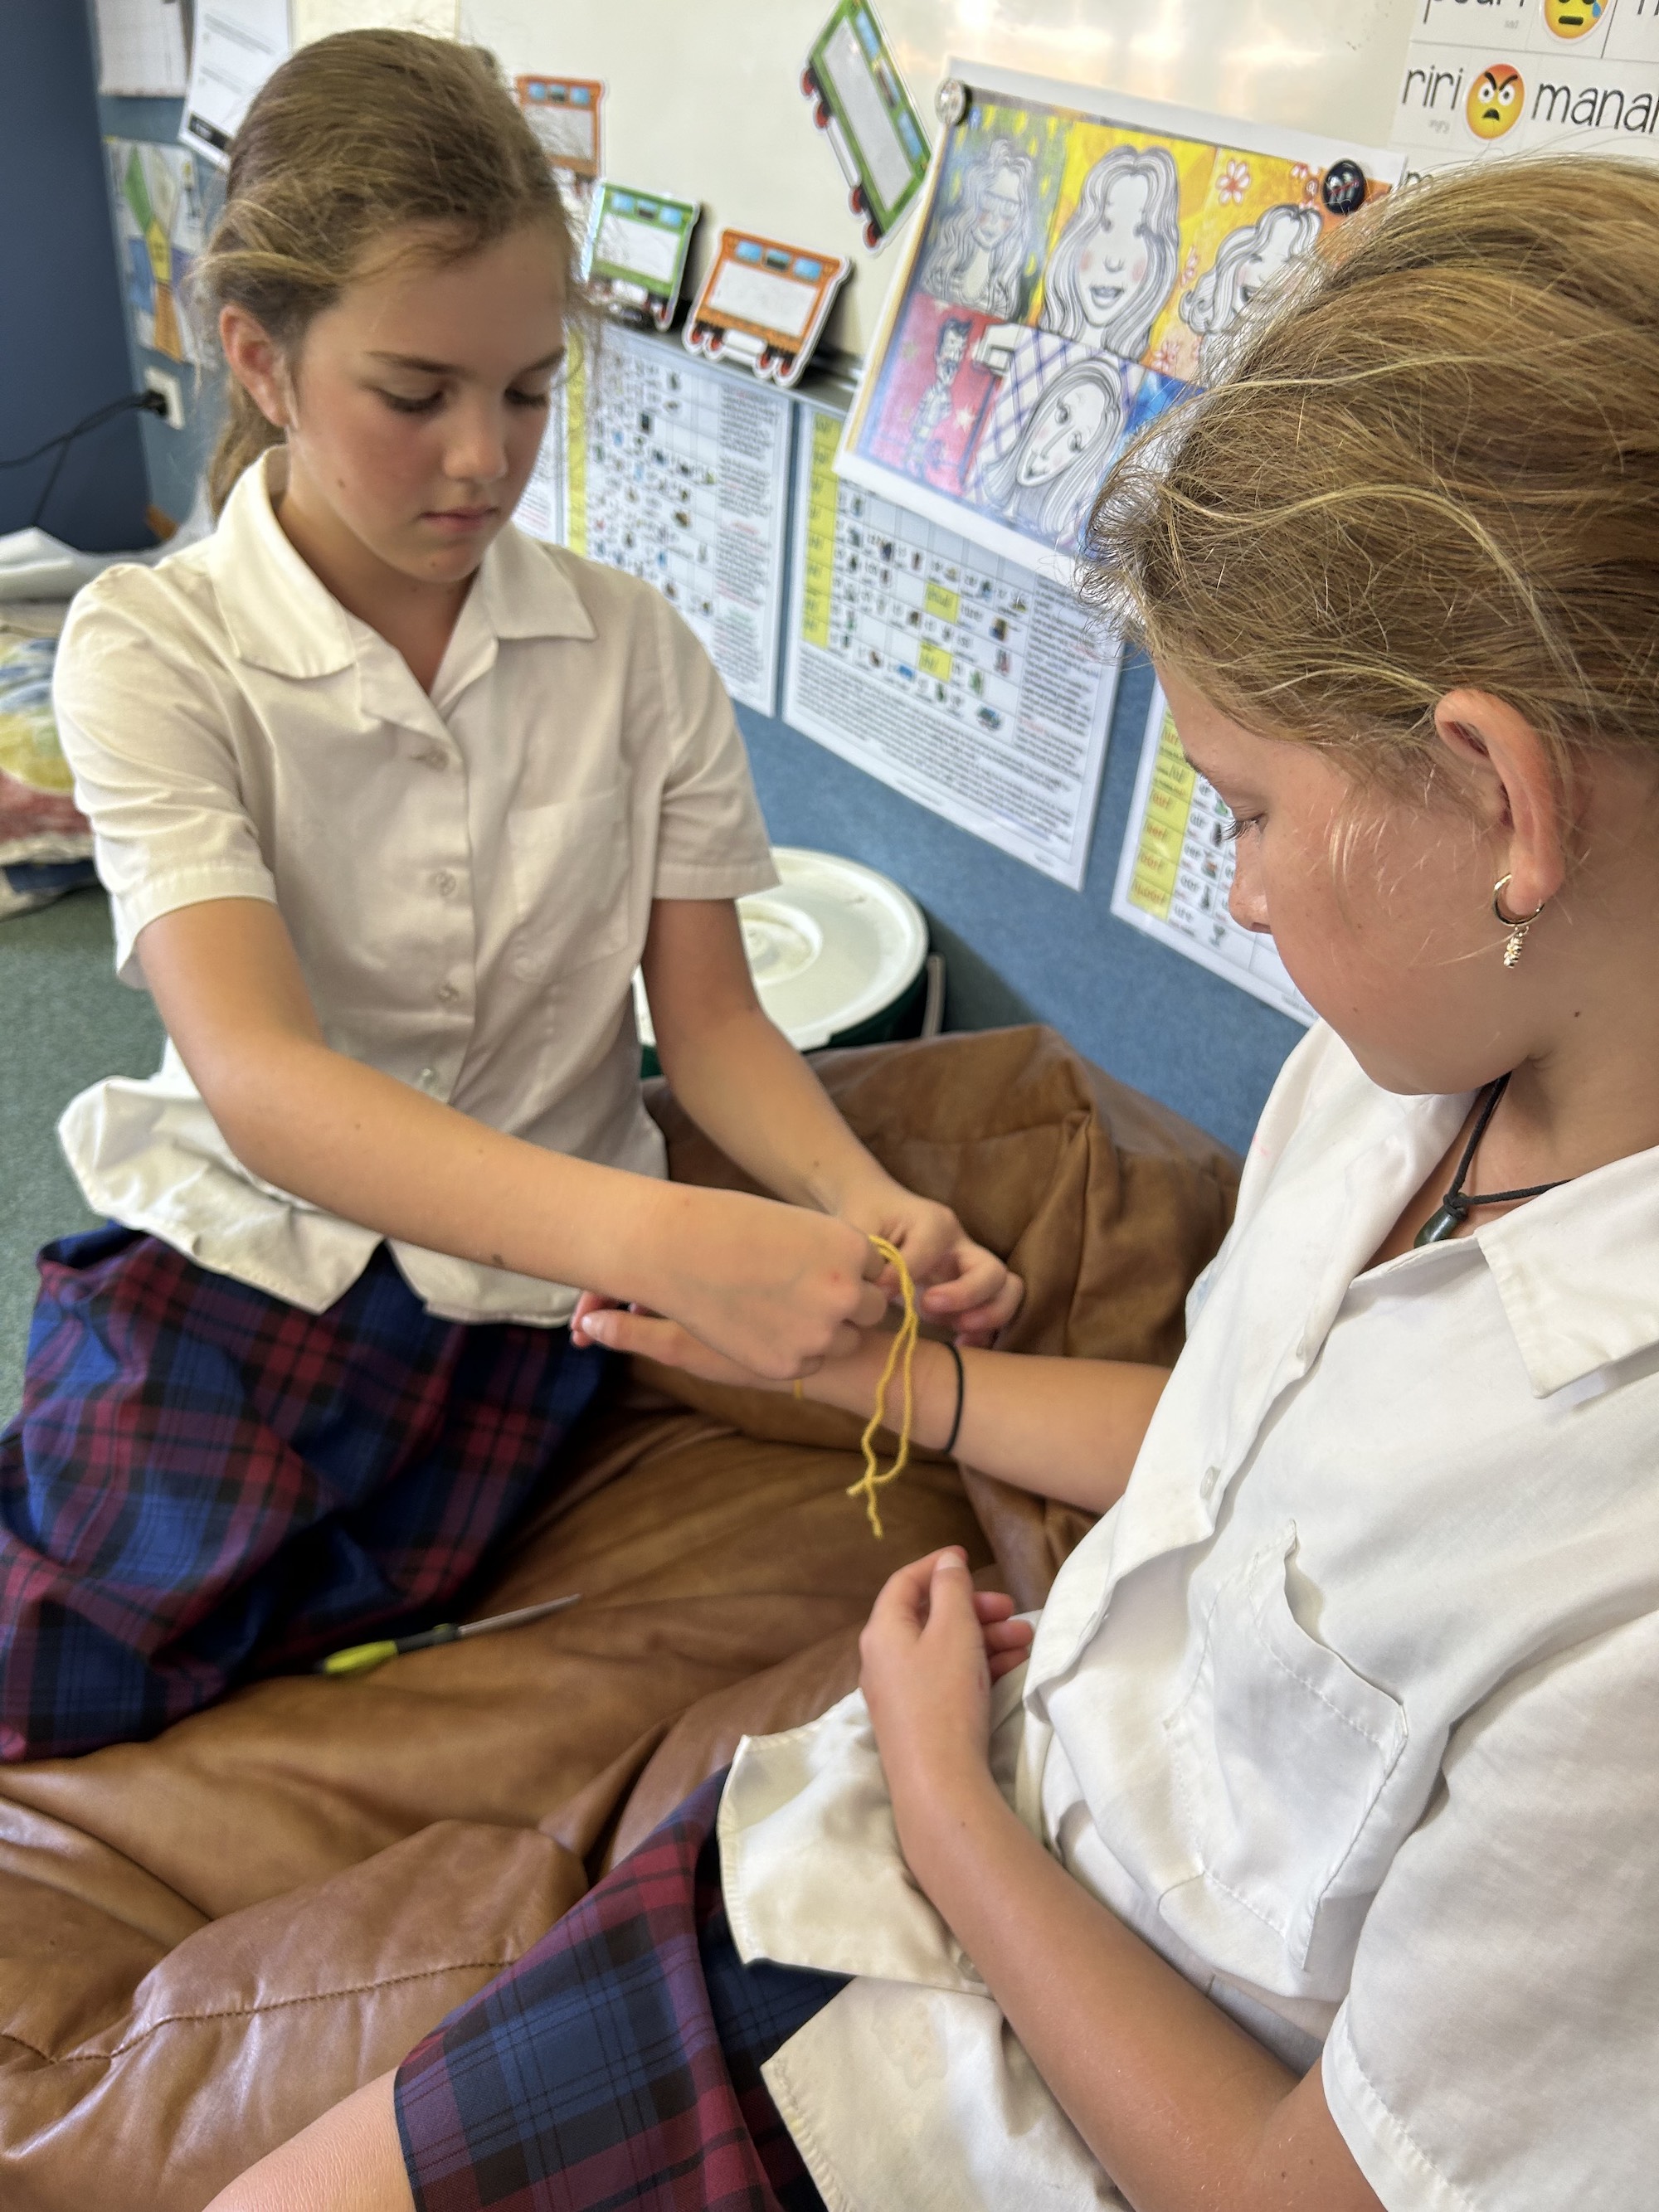
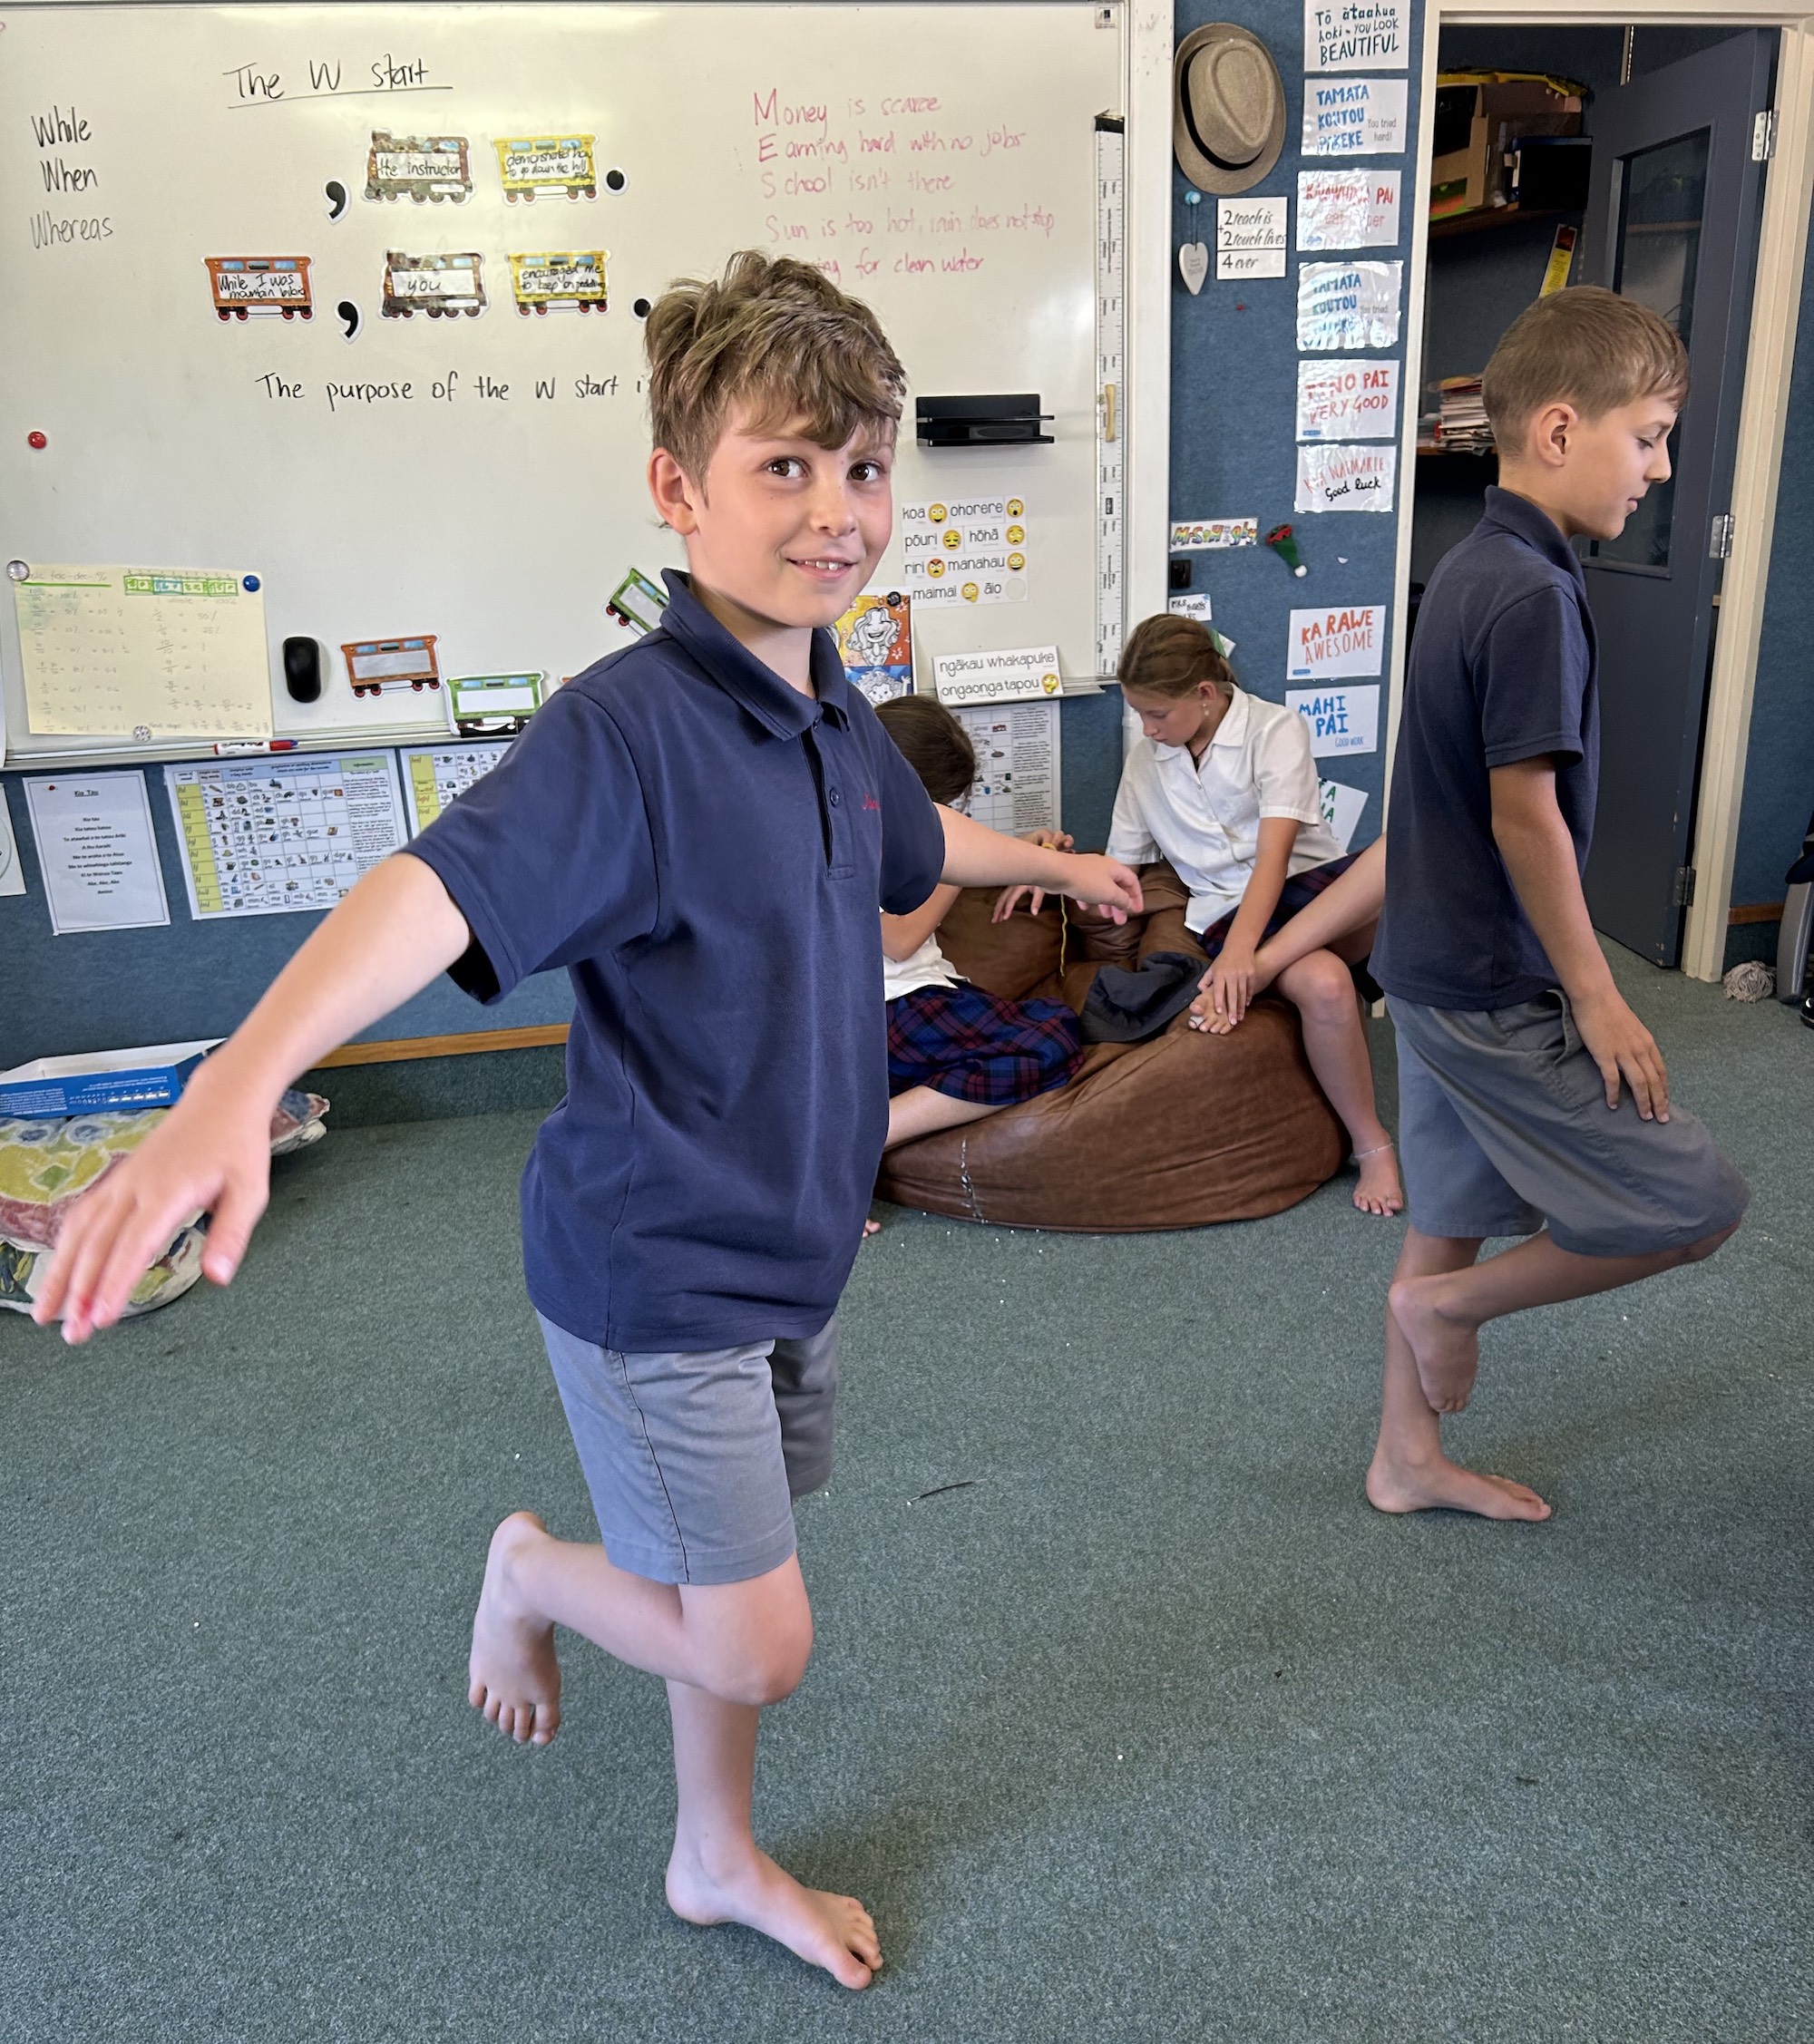
Thanks to Nicole Higby for sending these photos of students at Marian Catholic School taking part in CensusAtSchool!
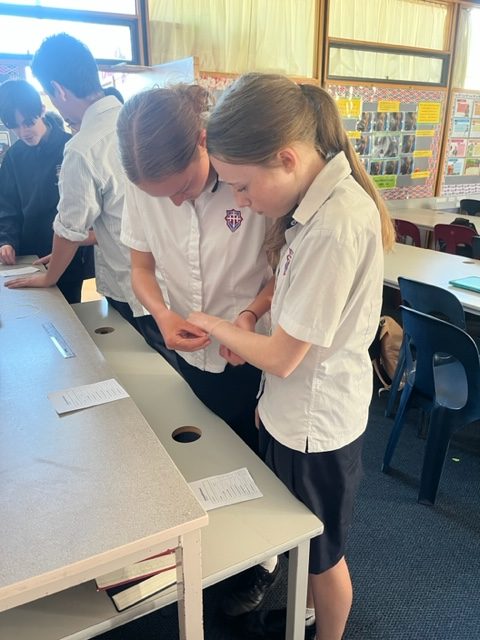
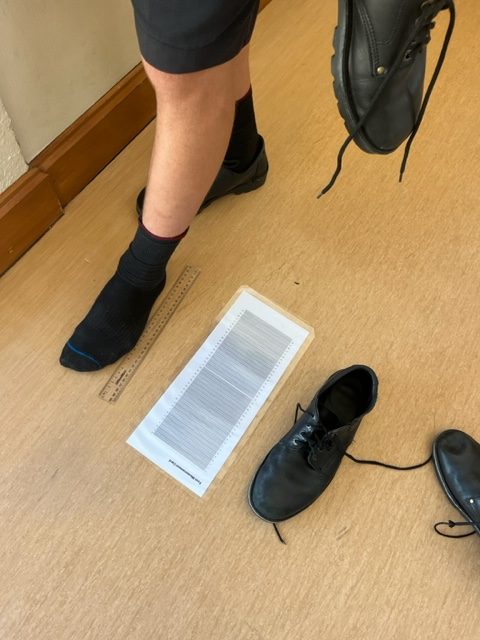
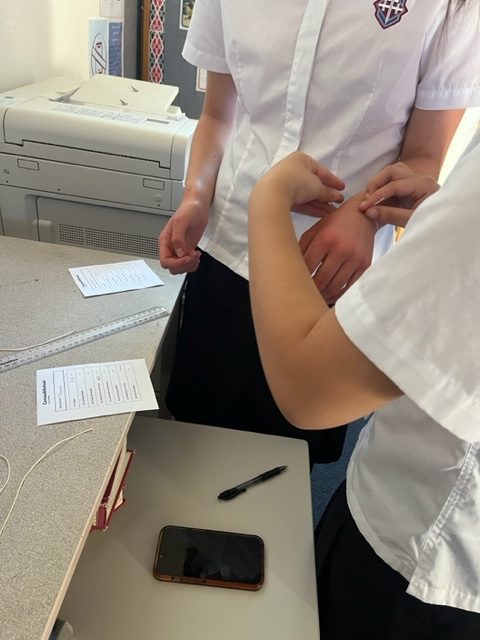
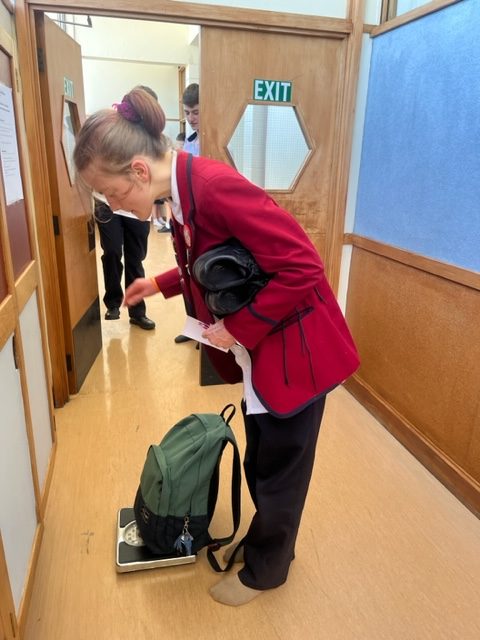
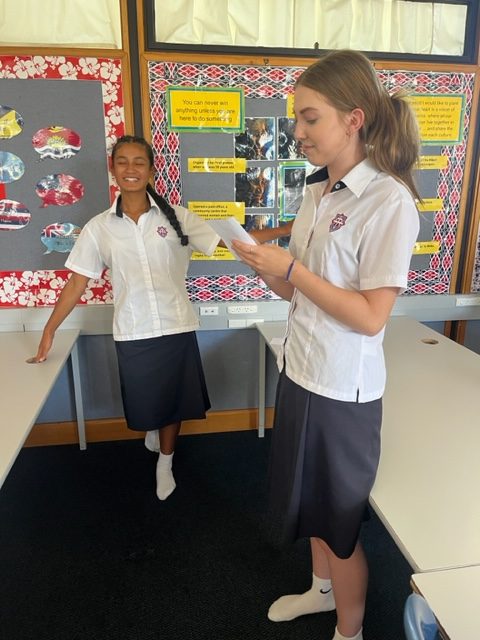
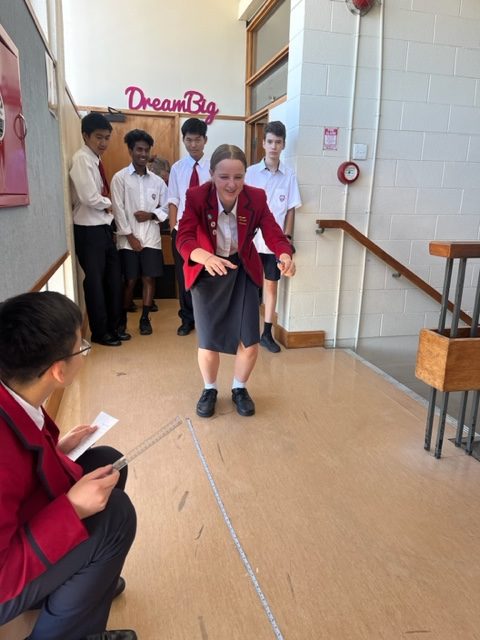
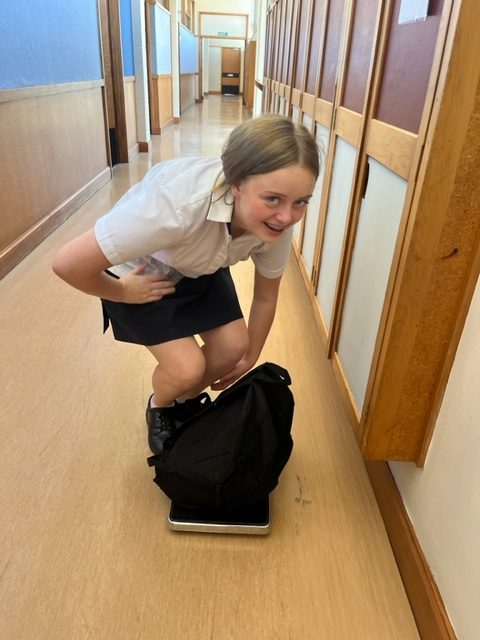
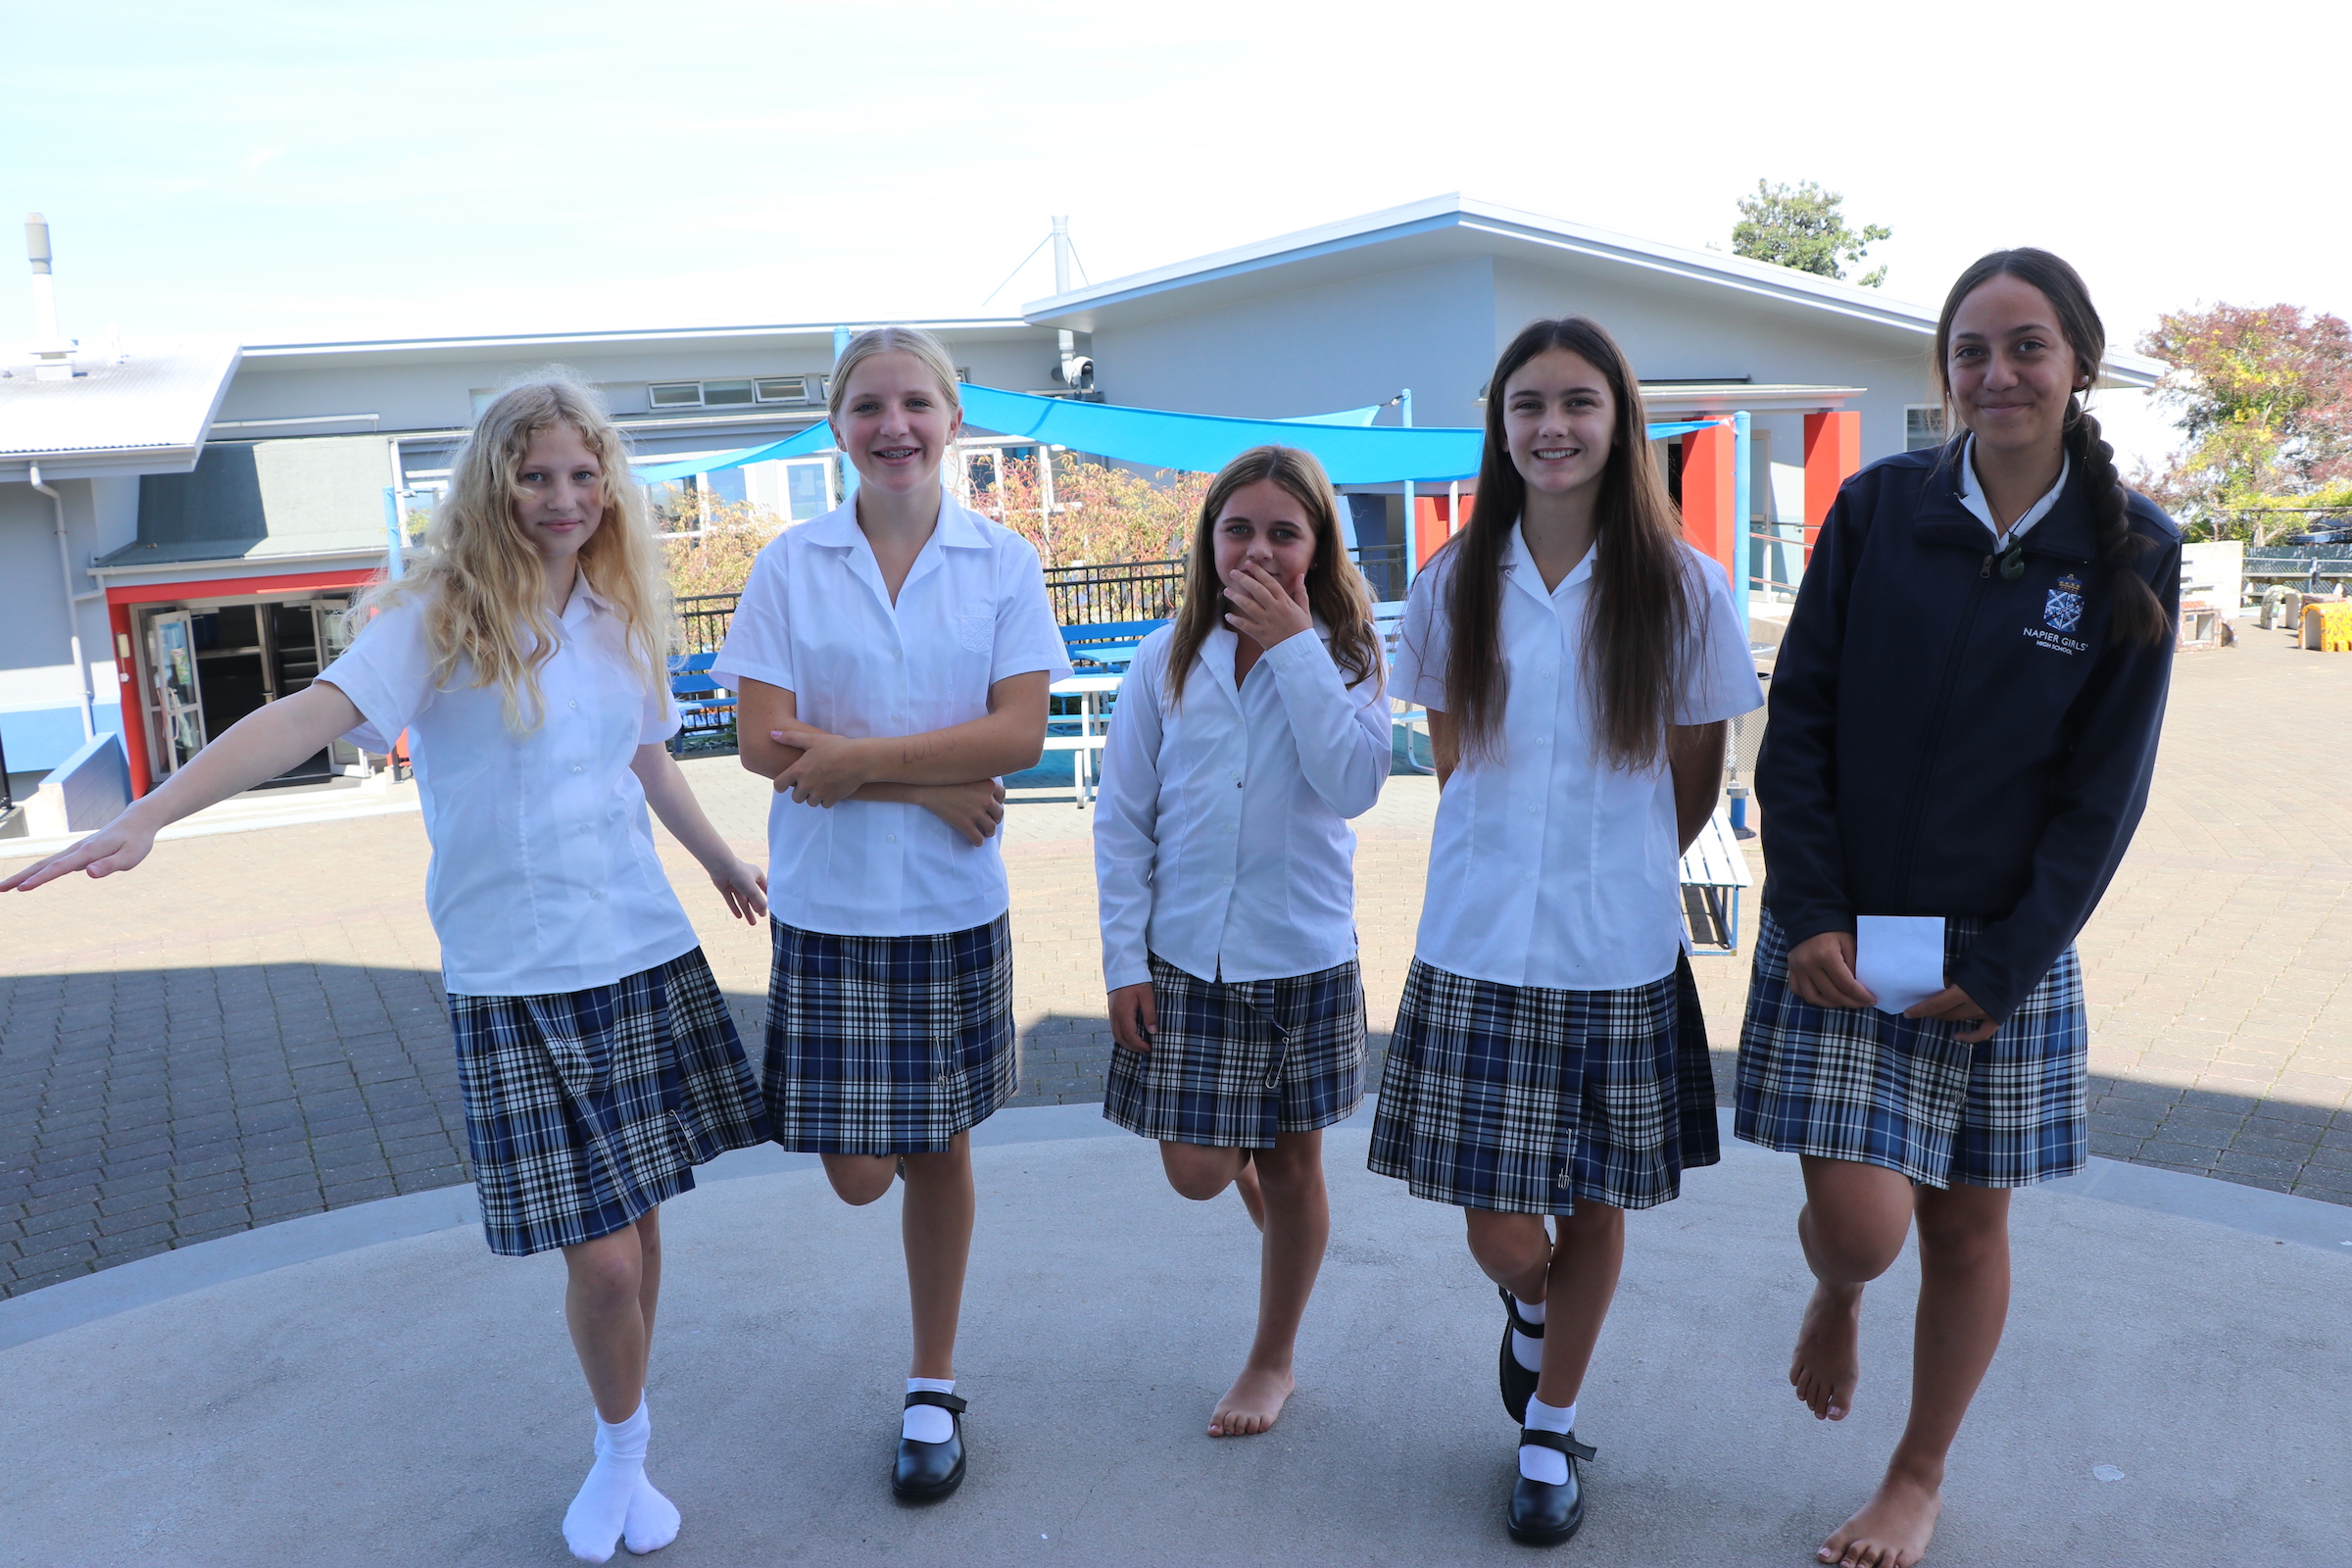
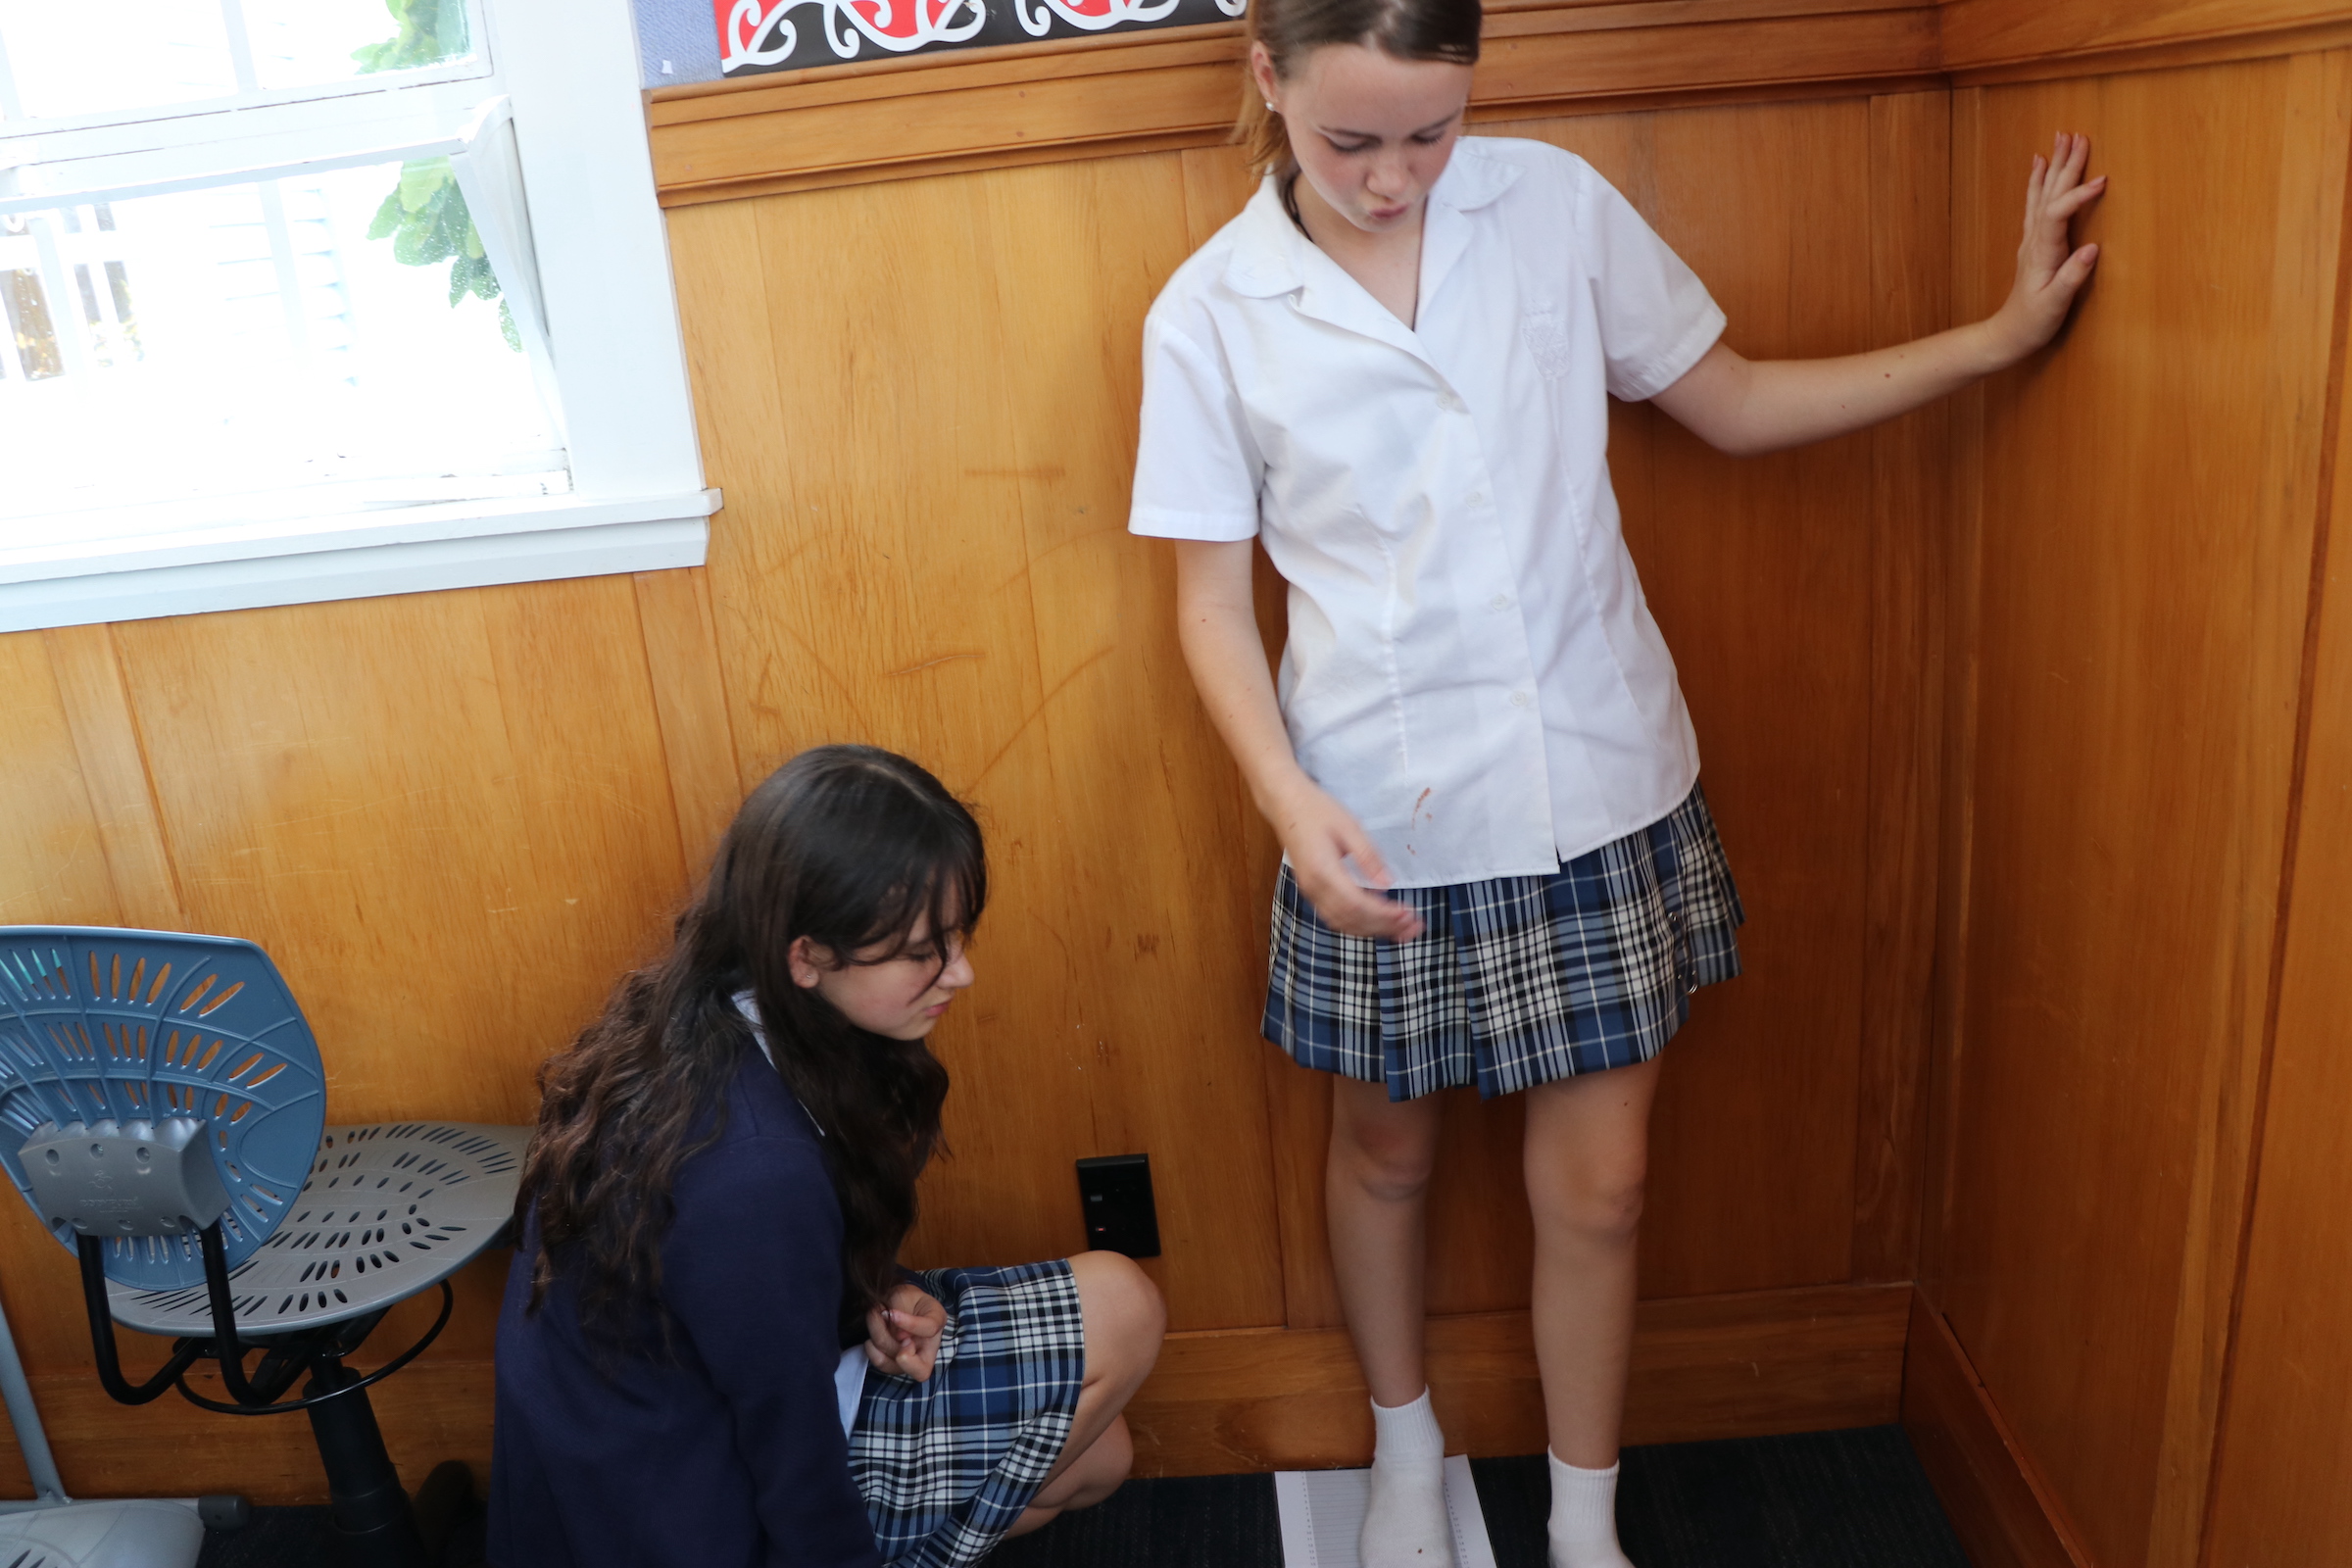
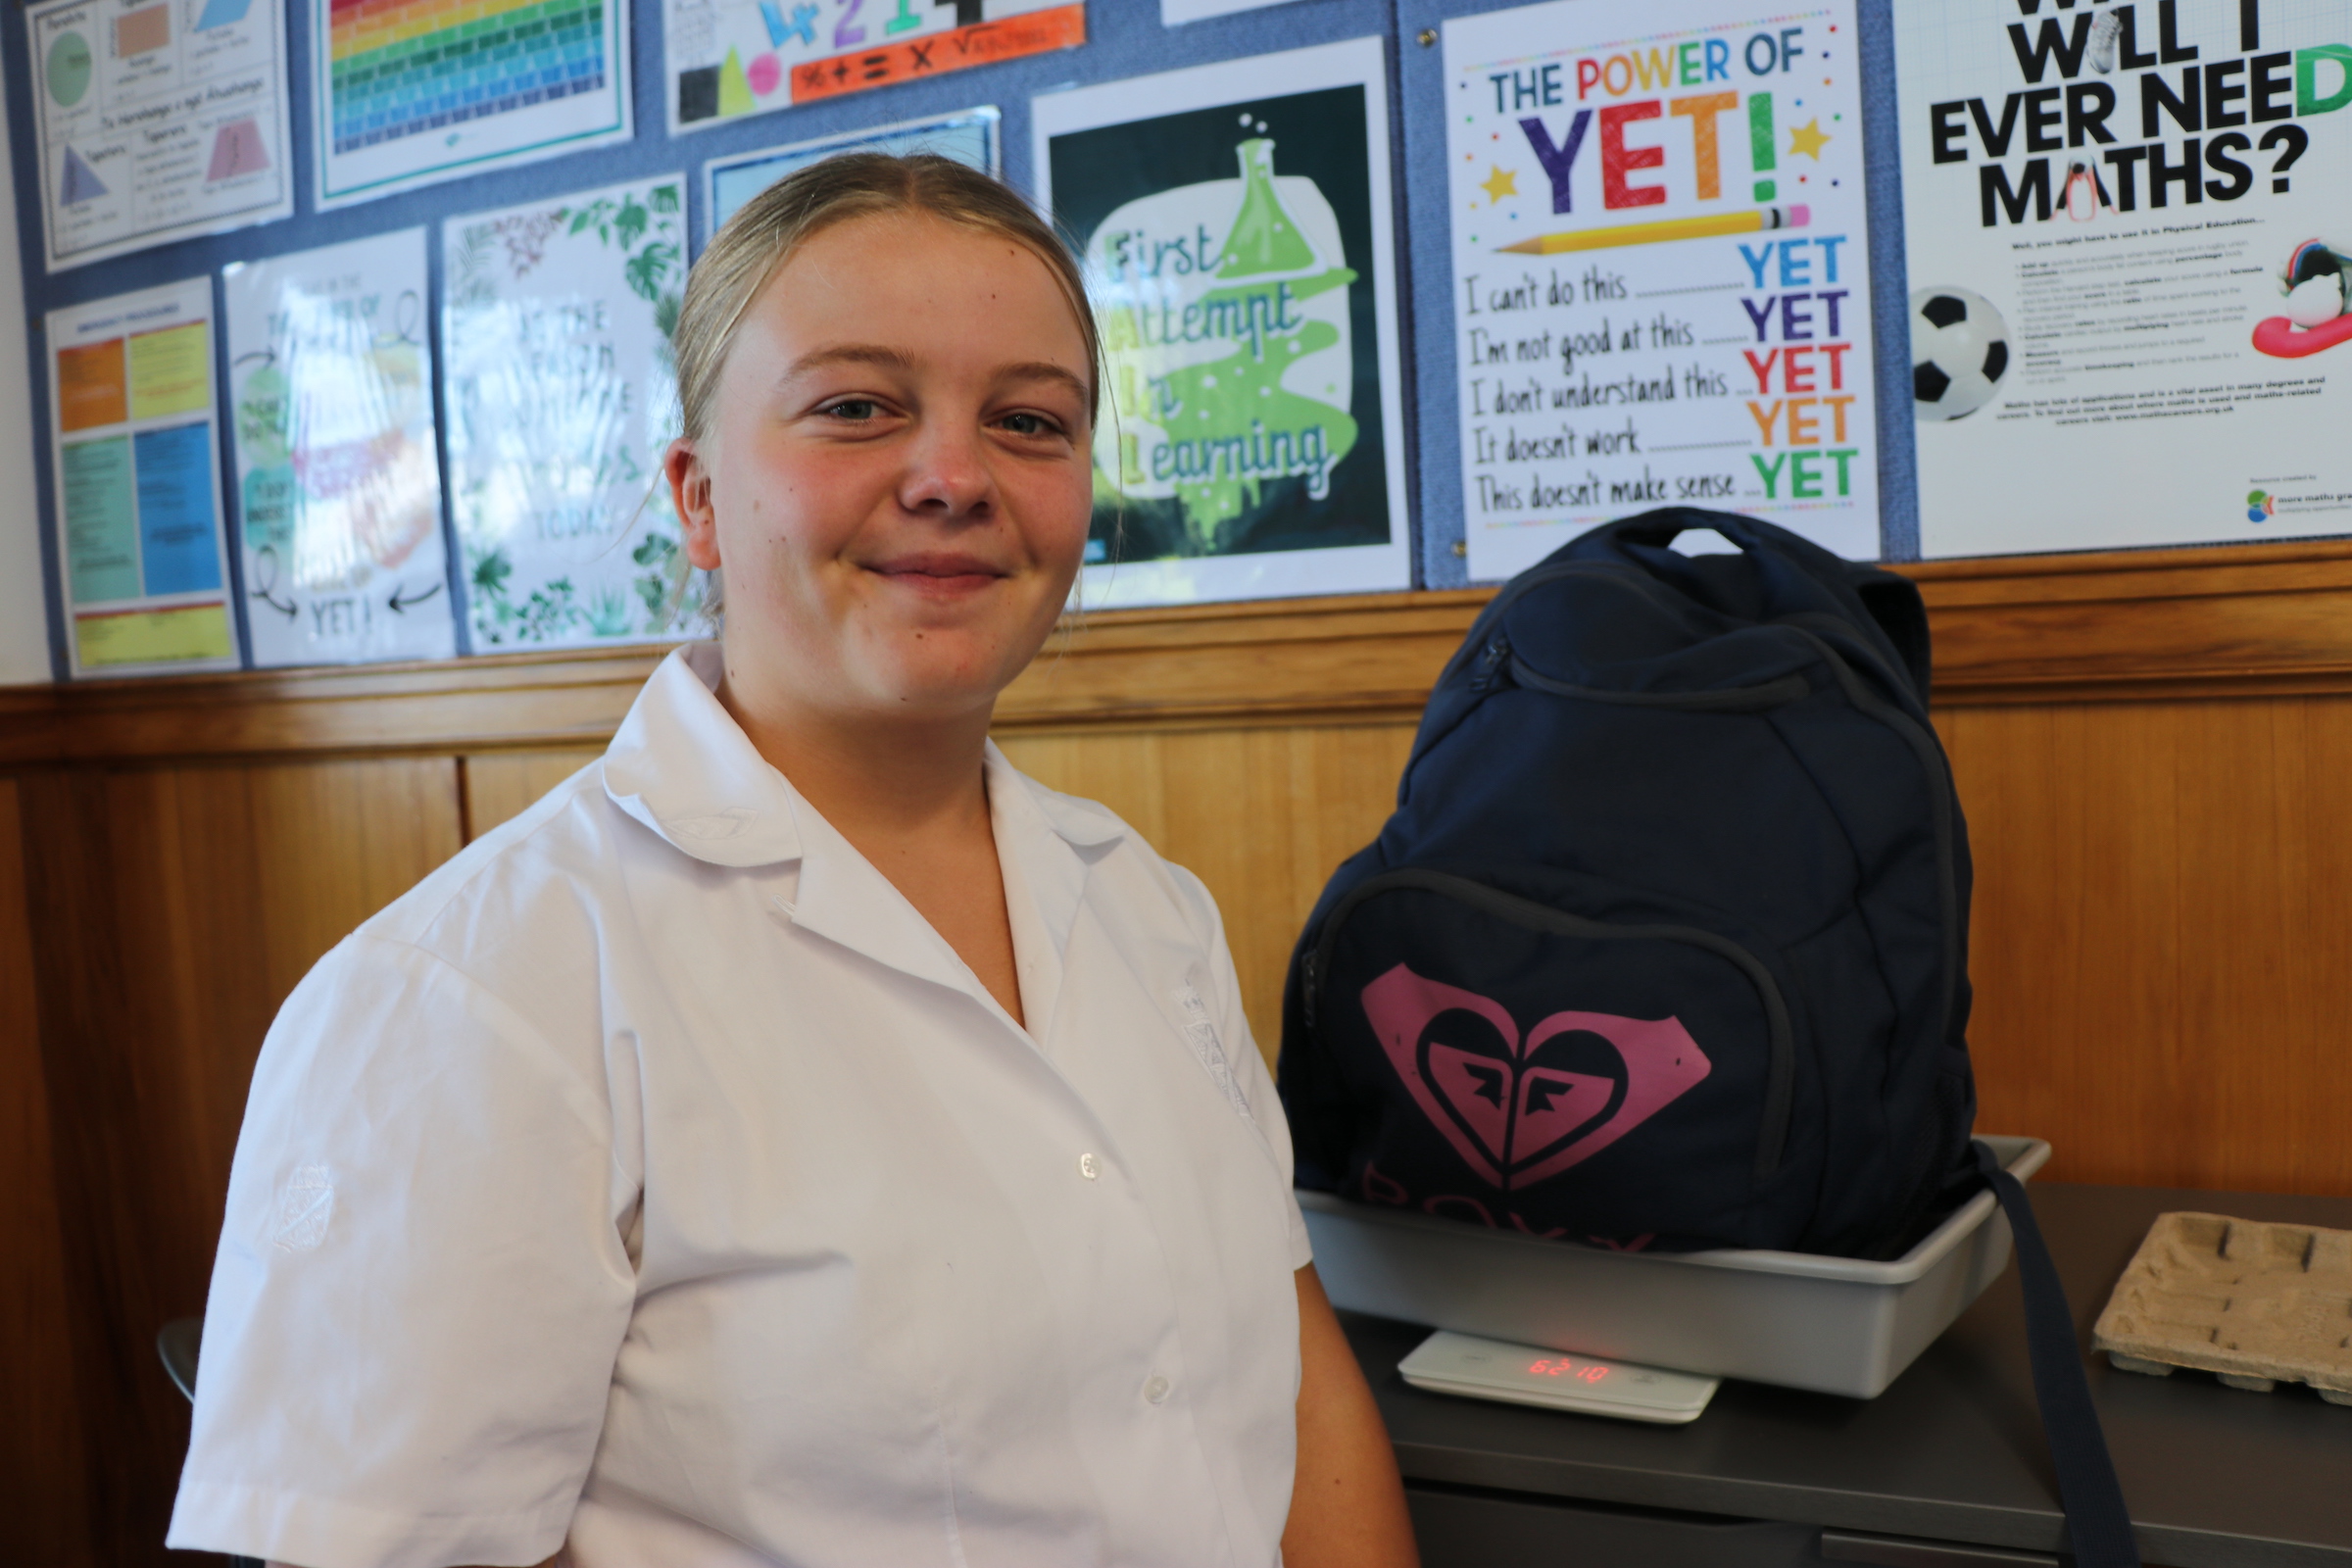
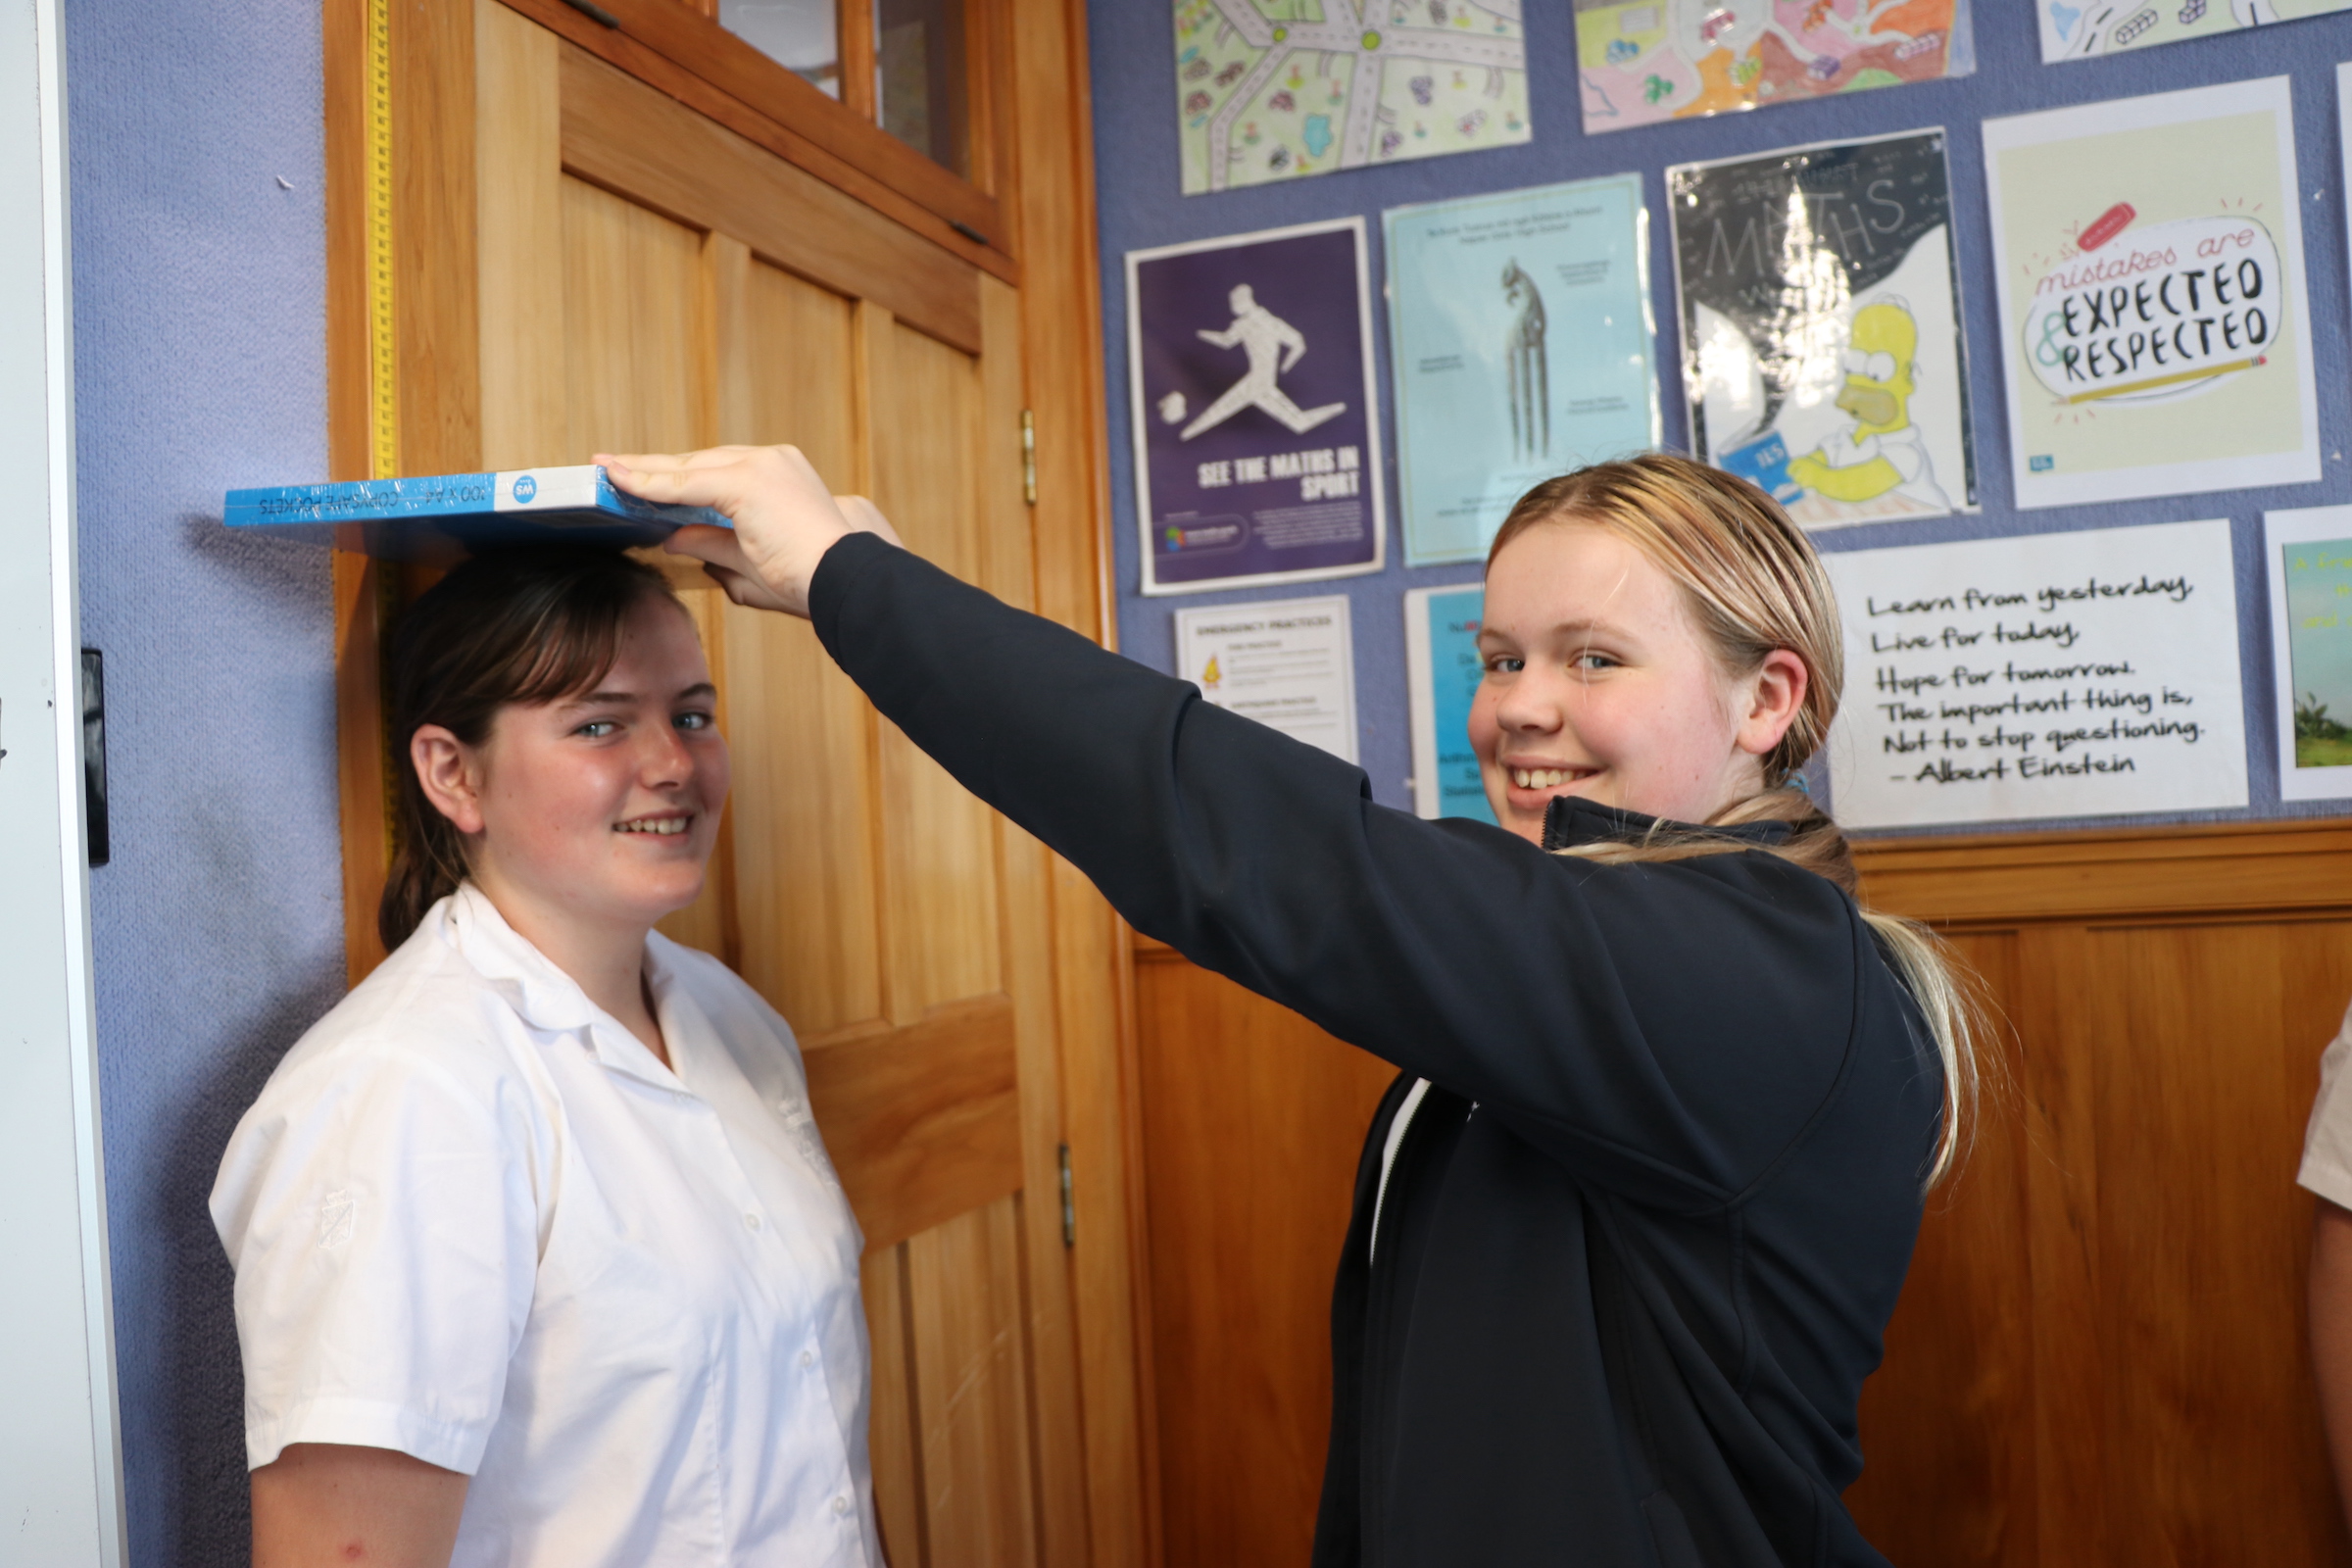
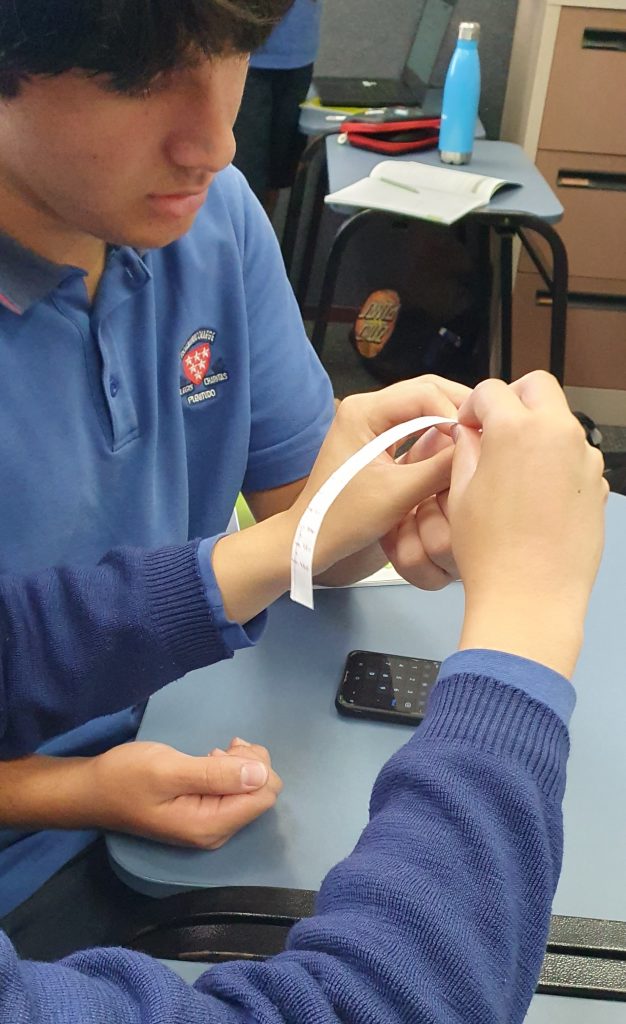
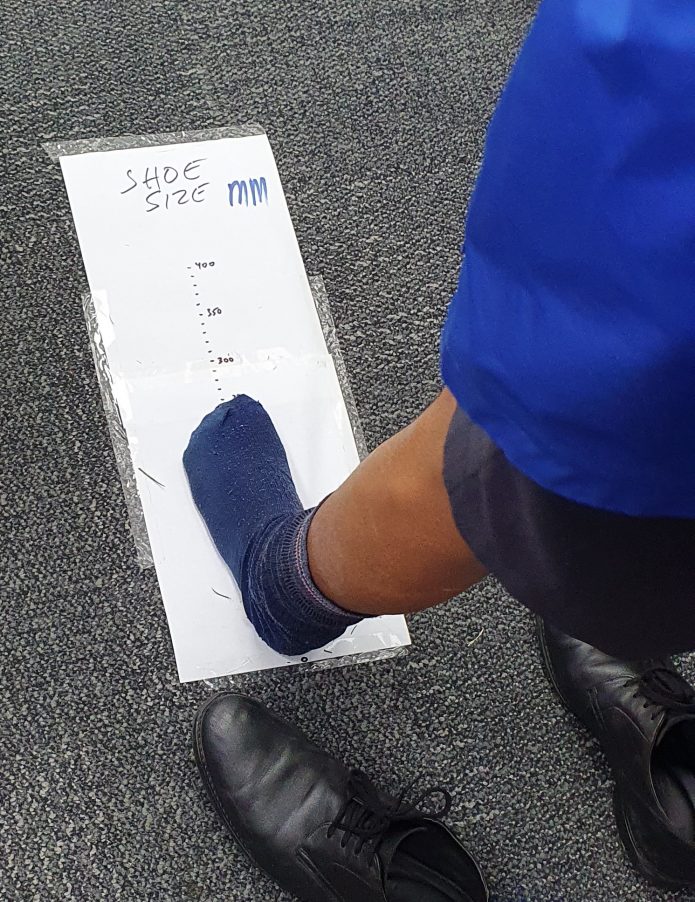
Thanks to Mark Lukkassen for sending these photos of students at Napier Girls’ High School taking part in CensusAtSchool!
Kia ora koutou,
Over 25,000 students have taken part so far! We’d love to make this our biggest year ever.
Thank you!! The questionnaire is open all year. We would love for you to take part during this term, but whenever it suits you best is fine too.
What’s new:
This data might be great to use for discussion in class! 47% said yes to pineapple being on pizza, 41% said no, and 12% did not know.

We’d love to see your students too!
Please email us to share.
FAQ
Can’t remember if you have registered or not?
Check by entering your email here. If your email doesn’t come up, register here. It’s never too late to register and take part.
Need your registration code?
Get it again here
Need your class data download link?
Get it again here
Unsure when you can take part?
Any time during school hours from Monday – it doesn’t need to be next week if it’s not convenient. The survey is open all year.
Need help preparing?
Please ensure that you have read the essential Teacher’s Guide. All the equipment needed to take part successfully with your students is included in it.
Want to take part over multiple days?
You can divide the activity into two sessions. Use the first session to take the measurements and fill in your data cards. Use the second session to fill in the survey online. The survey itself needs to be completed in one sitting by a student. However, different students from your class can fill it in on different days, for example if you have limited devices or some students are away.
Have another question?
Reply to this email and we’ll get right back to you! Or you can call Rachel Cunliffe on (027) 383-3746.
Ngā mihi nui,
Rachel, Anne, Pip, and Chris
Thanks to Jo Taia for sharing this video of her class at Carterton School taking part in CensusAtSchool.

Cookies and Cream is the favourite ice cream flavour by far according to over 20,000 young kiwis who have already taken part in this year’s CensusAtSchool survey. Almost a quarter of students chose Cookies and Cream as their favourite flavour, followed by 18% who chose Chocolate, and 11% who chose Vanilla.
Top 20 Favourite Ice Cream Flavours
In October 2022, Tip Top announced that it would stop making Goody Goody Gum Drops and Cookies and Cream 2-litre ice cream tubs. Cookies and Cream also won the Kids’ Choice Award at the New Zealand Ice Cream Awards last year.
The unique insight comes from CensusAtSchool TataurangaKiTeKura, a non-profit, online educational project that brings statistics to life. Supervised by teachers, students from Years 3-13 anonymously answer questions in English or te reo Māori on digital devices.
The eleventh biennial edition of CensusAtSchool TataurangaKiTeKura is expected to have the highest number of schools, teachers, and students participating. More than 40,000 schoolchildren are expected to participate in CensusAtSchool this year.
CensusAtSchool TataurangaKiTeKura is hosted by the Department of Statistics at the University of Auckland in association with Stats NZ and the Ministry of Education. CensusAtSchool is part of an international effort to boost statistical capability among young people.
Kia ora koutou,
We have had over 22,500 students taking part so far!
Thank you so much! The questionnaire is open all year. We encourage you to take part as soon as possible, but whenever it suits you best is fine.
What’s new:
We’d love to see your students too!
Please email us to share.
FAQ
Can’t remember if you have registered or not?
Check by entering your email here. If your email doesn’t come up, register here. It’s never too late to register and take part.
Need your registration code?
Get it again here
Need your class data download link?
Get it again here
Unsure when you can take part?
Any time during school hours from Monday – it doesn’t need to be next week if it’s not convenient. The survey is open all year.
Need help preparing?
Please ensure that you have read the essential Teacher’s Guide. All the equipment needed to take part successfully with your students is included in it.
Want to take part over multiple days?
You can divide the activity into two sessions. Use the first session to take the measurements and fill in your data cards. Use the second session to fill in the survey online. The survey itself needs to be completed in one sitting by a student. However, different students from your class can fill it in on different days, for example if you have limited devices or some students are away.
Have another question?
Reply to this email and we’ll get right back to you! Or you can call Rachel Cunliffe on (027) 383-3746.
Ngā mihi nui,
Rachel, Anne, Pip, and Chris
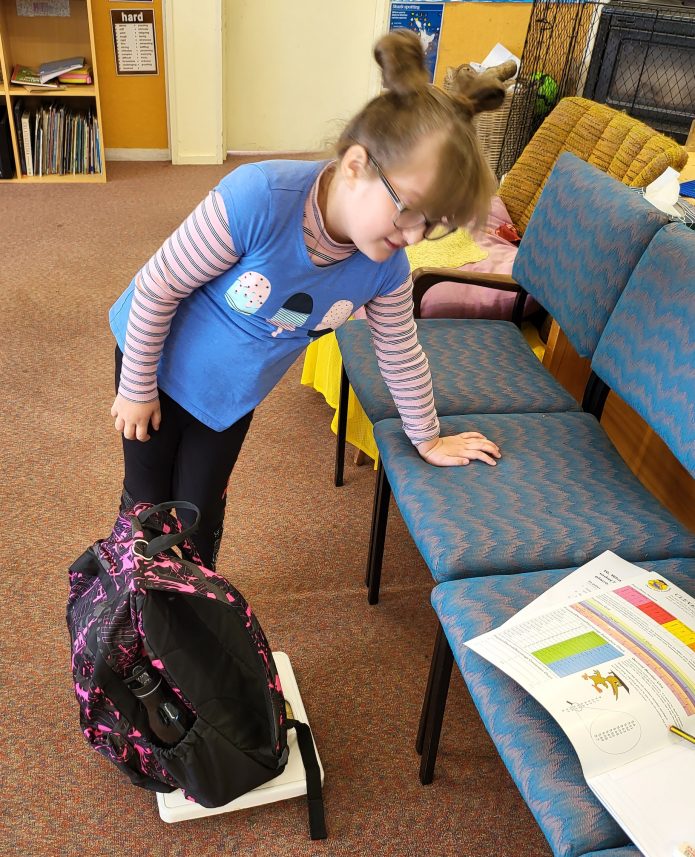
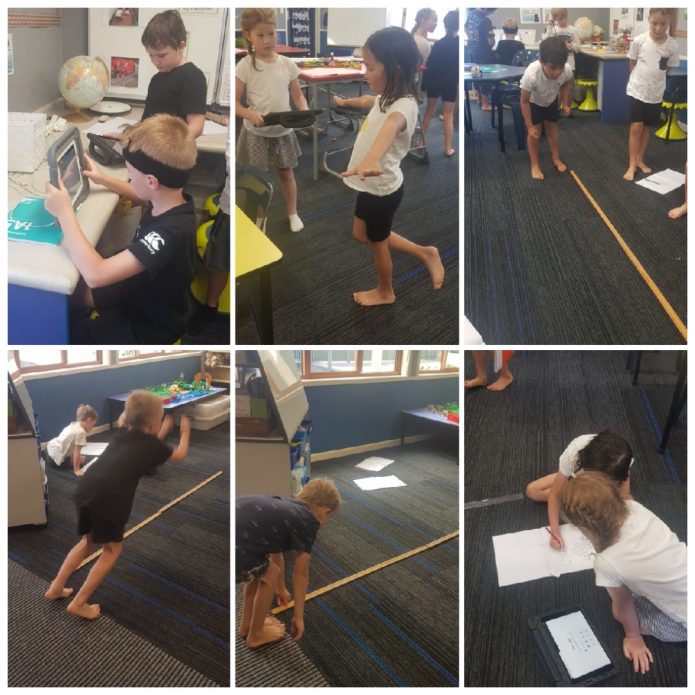
Thanks to Nicky Bell for sending us these photos of students at Purakaunui School taking part in CensusAtSchool.
Thanks to Trish Molloy for sending these photos of Matai Class at Turitea School (Y3/4) having great fun filling in the Census for 2023.

Thanks to Shah Anwar for sending these photos and video of students at Rosmini College taking part in CensusAtSchool!
Thanks to Jill Armstrong from Trinity Catholic College for sending these photos of students having fun taking part in CensusAtSchool!