A large national survey that will give an intriguing glimpse into schoolchildren’s lives launches today.
Thousands of primary, intermediate and secondary school students around the country will share their views on issues as wide-ranging as climate change, the amount of time they spend on digital devices, and how they handle interpersonal issues. Senior students will be asked to also share their own attitudes and perceived parental attitudes to activities such as drinking and smoking by young people.
The students are taking part in CensusAtSchool New Zealand, known in te reo Māori as TataurangaKiTeKura Aotearoa, a non-profit, online educational project that aims to bring statistics to life in both English and Māori-medium classrooms. It is run by the Department of Statistics at the University of Auckland in partnership with the Ministry of Education and Stats NZ.
Supervised by teachers, students from years 5-13 anonymously answer questions in English or te reo Māori on digital devices. Some questions involve practical activities such as measuring the length of their right feet and weighing their laden schoolbags. Others will seek their views and experiences on a range of social and personal issues.
Up to 30,000 schoolchildren are expected to participate in CensusAtSchool this year. By late last night, more than 1,509 teachers from 775 schools had already registered. The census runs until July 5.
This is the ninth edition of CensusAtSchool, and co-directors Professor Chris Wild and Rachel Cunliffe say that it’s shaping up to be the biggest ever. Professor Wild, an expert in statistics education, says that the project is appealing because it produces data that is relevant and real to students, their friends and families.
“The students experience the whole statistical cycle – they fill in the survey, and then they use statistical methods to explore the data and tell the stories in it,” he says. “It helps students see the benefits of statistics in society – and they love finding out what other kids their own age are thinking and doing.”
Rachel Cunliffe, a former University of Auckland statistics lecturer who now runs a digital design company, says teachers are always looking for cross-curricular activities. CensusAtSchool is a rich resource with its reach across statistics and maths, health, social studies, geography, media studies, technology and science.
CensusAtSchool is part of an international effort to boost statistical capability among young people and is carried out in Australia, Canada, the United States, Japan and South Africa. The countries share some questions so comparisons can be made.
The only national survey to comprehensively chart children’s views of their own lives is taking place across New Zealand from March 4. This year, we will learn from Kiwi kids on issues as wide-ranging as climate change, the amount of time they spend on digital devices, how they handle interpersonal issues, and their own attitudes and perceived parental attitudes to activities such as drinking and smoking by young people. Preview the questions in English and te reo Māori here.
CensusAtSchool New Zealand, known in te reo Māori as TataurangaKiTeKura Aotearoa, is a non-profit, online educational project that aims to bring statistics to life in both English and Māori-medium classrooms. Supervised by teachers, students from years 5-13 anonymously answer 30 questions in English or te reo Māori, and later explore the results in class. CensusAtSchool runs every two years, and in 2017, more than 32,000 students took part, representing 534 schools and 1,062 teachers.
CensusAtSchool, now in its ninth edition, is a collaborative project involving teachers, the University of Auckland’s Department of Statistics, Statistics New Zealand and the Ministry of Education. It is part of an international effort to boost statistical capability among young people, and is carried out in Australia, the United Kingdom, Canada, the US, Japan and South Africa. The countries share some questions so comparisons can be made.
Rise of the machine learners:
Statistical learning in the computational era
Don’t miss this set of four lectures held from March to April. Get a group together, invite your colleagues from other departments, or take your stats scholarship students. See the program: IhakaDLE19.
|
||||||||||||
Robyn Headifen and Marion Steele’s HOD day workshop examined the characteristics of good Statistics teachers.
They both recommended SET Statistical Education of Teachers as professional reading. This is available via the US website: http://www.statisticsteacher.org/
Ideal professional reading for a department with new or developing Stats teachers.
There were many other resources for Statistics shared by presenters on the AMA HOD/F/UH day.
Literacy for University Entrance: Views from NZSA Education Committee
Literacy and Statistics
The Education Committee of the New Zealand Statistical Association (NZSA) is very pleased to
see that the New Zealand Qualifications Authority (NZQA) is consulting on the University
Entrance (UE) Literacy List. This statement is offered as input into NZQA’s review (via
UEchanges@nzqa.govt.nz), and is being made available on CensusAtSchool. We are part of a
‘subject association’ (as in the consultation document) with a strong ‘interest in the list’.
NZQA’s consultation document is at
http://www.nzqa.govt.nz/about-us/consultations-and-reviews/consultation-review-of-the-universit
y-entrance-literacy-list/.
We see it as extremely important that achievement standards from areas like and including
Statistics remain in and are added to the list. Statistics at present has two standards in the list,
with no proposed removals or additions. They are: 91266, 2.11, int (Reading only); and 91584,
3.12, ext (Reading and Writing both);. Other Statistics internal standards require a written report
and evaluation of evidence, usually in writing. We would like to see some more of the L2 and L3
Statistics standards count towards UE literacy.
Tension between text and other methods of communication
We see a tension between the need for written work and the need to allow students
opportunities to present their best evidence against a standard in a variety of ways.
We think it is completely fair that NZQA requires UE literacy writing evidence to come from work
that is written. It makes sense, at present, to exclude standards where this cannot be
guaranteed. However, If a large number of standards were required to be assessed entirely in writing, the
results could include student overwork and boredom, teacher overwork, and student flight.
We would like to see more flexibility in how students gain literacy, and a change to the difficulty
that many schools and students face at present. We see the need for a dialogue to find
solutions to this tension.
One such solution would be to require the submitted work to include a written abstract or
summary, for nominated standards. This is an important part of science communication across
many subjects, and would fit well with other methods of presentation.
Another solution would be to make some standards restricted to written reports, so they could
count towards UE literacy, and to keep others with open assessment.
We are aware of a strong teacher view that, under the present system, many students have
difficulty meeting the UE literacy requirements. As Statistics is the second largest subject at
NCEA Level 3, increased opportunities for UE literacy within our communication-focused subject
would be beneficial for many students.
Ongoing dialogue
In the light of:
● student difficulties in meeting UE literacy requirements,
● the large amount of UE literacy-relevant work often done at present for the statistics
standards, especially the internals,
● and the large number of students who attempt NCEA Level 3 Statistics Achievement Standards,
we would like to see a solution where more statistical standards count for UE literacy.
We are happy to expand on our ideas and possible solutions with NZQA, if and when that is
useful. ‘
To contact the Education Committee, please email the Committee’s Convenor:
alasdair.noble@agresearch.co.nz.
Tonight is the last in this years Ihaka Lecture series. If you missed any you can watch them at: Link: https://www.stat.auckland.ac.
Speaker: Alberto Cairo
Affiliation: University of Miami
Title: Visual trumpery: How charts lie
Date: Wednesday, 21 March 2018
Time: 6:30 pm to 7:30 pm
Location: 6.30pm, Large Chemistry Lecture Theatre, Ground Floor, Building 301, 23 Symonds Street, City Campus, Auckland Central.
In our final 2018 Ihaka lecture, Alberto Cairo (Knight Chair in Visual
Journalism at the University of Miami) will deliver the following:
Visual trumpery: How charts lie — and how they make us smarter
Please join us for refreshments from 6pm in the foyer area outside the
lecture theatre.
With facts and truth increasingly under assault, many interest groups have
enlisted charts — graphs, maps, diagrams, etc. — to support all manner of
spin. Because digital images are inherently shareable and can quickly
amplify messages, sifting through the visual information and misinformation
is an important skill for any citizen.
The use of graphs, charts, maps and infographics to explore data and
communicate science to the public has become more and more popular.
However, this rise in popularity has not been accompanied by an increasing
awareness of the rules that should guide the design of these
visualisations. This talk teaches normal citizens principles to become a more critical and
better informed readers of charts.
Biography:
Alberto Cairo is the Knight Chair in Visual Journalism at the University of
Miami. He’s also the director of the visualisation programme at UM’s Center
for Computational Science. Cairo has been a director of infographics and
multimedia at news publications in Spain (El Mundo, 2000-2005) and Brazil
(Editora Globo, 2010-2012,) and a professor at the University of North
Carolina-Chapel Hill. Besides teaching at UM, he works as a freelancer and
consultant for companies such as Google and Microsoft. He’s the author of
the books The Functional Art: An Introduction to Information Graphics and
Visualization (2012) and The Truthful Art: Data, Charts, and Maps for
Communication (2016).


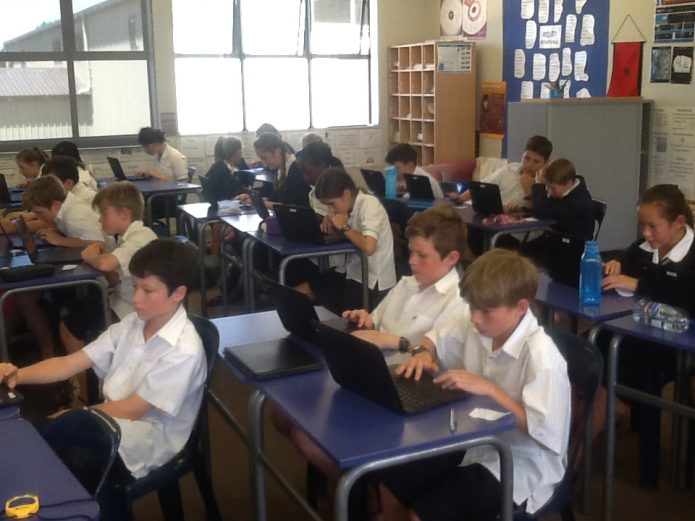
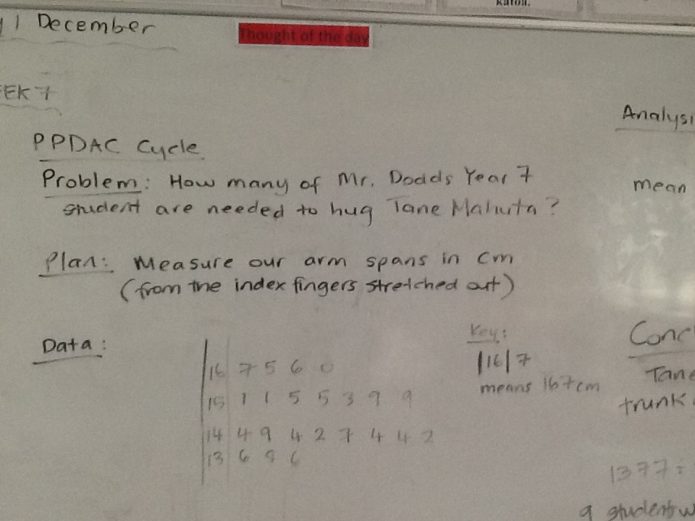
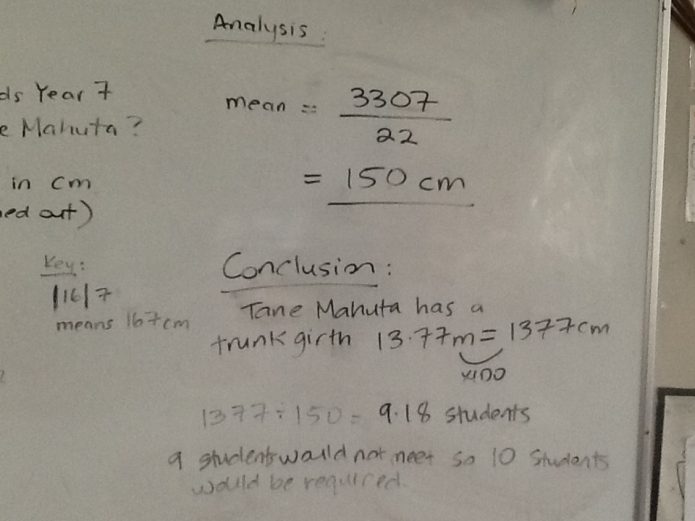
Thanks to Vicki Haverkort, HOD Mathematics at Huanui College for sending these photos of Year 7 students entering their CensusAtSchool data and how they used the data to model the PPDAC cycle.
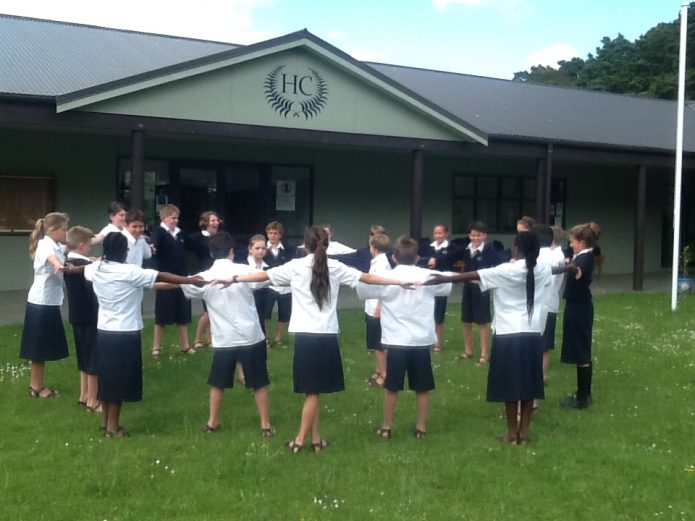
Students stood in a circle to visually see how large Tane Mahuta’s girth is at the end of the lesson.
Stats NZ have analysed the data. View the newsletter from Stats NZ, a great resource to share with your colleagues.
Features: NZ climate change (excellent short video) and internet usage.
Sign up to receive new information releases.
The Friday Institute have opened registration for MOOCs (Massive Open Online Courses) Fall 2017.
Two of these will be of interest to teachers of Statistics, or pair up with another subject area to look for overlaps!
Teaching statistics through data investigations
Teaching statistics through inferential reasoning

