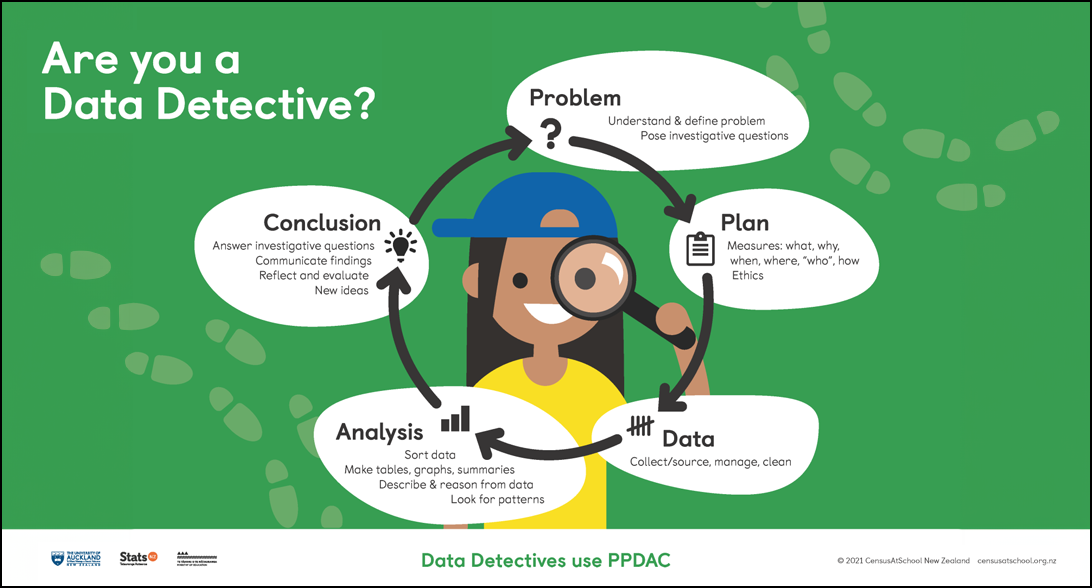
We’ve had many emails from concerned teachers asking whether the PPDAC statistical enquiry cycle has been removed from the curriculum.
Where the misunderstanding came from
There is no reference to the statistical enquiry cycle in What you told us and how we responded | Mathematics and Statistics Years 9-10, however, in What’s New in Mathematics and Statistics 0-8 (page 2), it says:
“Changes to the Statistics and Probability strands have been made. Statistics and probability are written with a different focus as the statistical enquiry cycle is no longer used as the main structure for the strands [in the curriculum statements]. In most year groups, you will see a reduction in the amount to teach for these strands; the probability strand now begins at year 5.”
Note: Bold underline is our emphasis, and the highlighted statement (our statement) is clarifying where the statistical enquiry cycle is no longer used as the main structure.
What this means in practice
To reassure you that the statistical enquiry cycle underpins good statistics teaching and learning have a look at this example using the Year 3 level statements, rearranged to show how you would still use the PPDAC cycle in your teaching and learning.
Next week, we will share what this might look like for Year 9.
Curriculum document statements:
- Collecting numerical data by asking an investigative question with a response that is a count or a discrete measurement (i.e. a whole number) (e.g. How many teeth have been lost by the students in our class? What are the shoe sizes in the class?)
- A numerical variable in data is a number that is a measure or a count.
OUR COMMENTARY
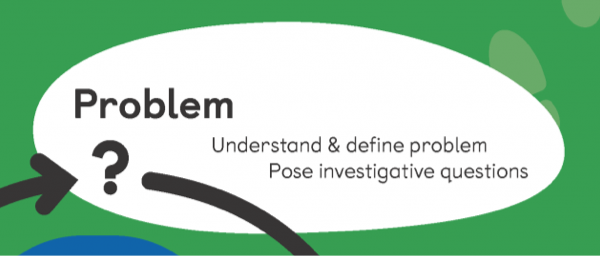
These curriculum statements indicate firstly that students are working to answer an investigative question, the investigative question on lost teeth connects to the activity Y2 Our Lost Teeth – PPDAC cycle on CensusAtSchool. We have written it for Year 2, but it can be adapted for Year 3 students as well.
The second thing that these statements show us is that in Year 3 students are moving to using numerical data as well.
Curriculum document statements:
- Collecting categorical data and sorting the responses
- Collecting numerical data …
OUR COMMENTARY
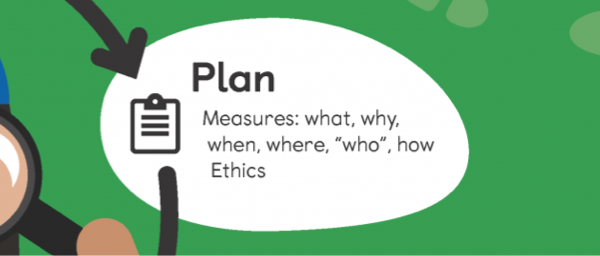
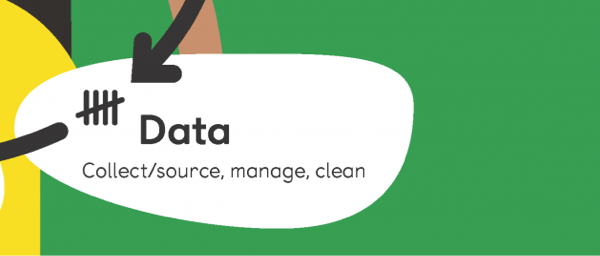
These curriculum statements clearly show that students are collecting primary data, both categorical and numerical. Behind the scenes, teachers will be supporting students to plan to collect the data, even though this is not specifically mentioned. The Year 3 statistics plan on CensusAtSchool connects you to good teaching and learning activities on Tāhūrangi and CensusAtSchool that are at a level appropriate for Year 3 students. Parties and favourites is a good model for ideas about planning for data collection.
Curriculum document statements:
- Creating data visualisations for categorical and numerical data
- Describing data visualisations using the variable name and the context and giving the frequency for each category or number
- Data visualisations are representations (including dot plots and bar graphs) of all available values for a variable that show the frequency for each value.
- In a bar graph, each bar corresponds to a category or number, and the height of the bar (for a vertical chart) or the length (for a horizontal chart) directly corresponds to the frequency of the category or number.
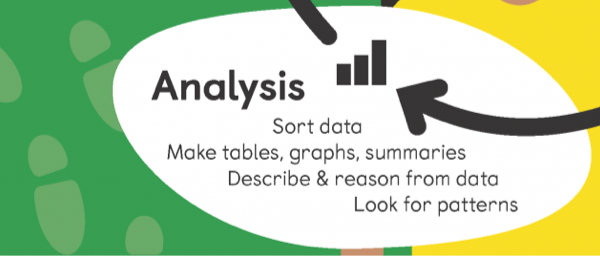
OUR COMMENTARY
These curriculum statements, particularly the top two, clearly speak to “doing” the analysis as we would using the PPDAC cycle. There are also some good ideas in the current curriculum teaching considerations – keep this doc as an extra resource.
Teaching considerations for analysis Years 1-3 – 2024 curriculum
- Show creating and describing data visualisations, transitioning from data cards to dot plots to bar graphs.
- Represent data using data cards and picture graphs (for Years 1–3), frequency tables and dot plots (for Years 2–3), and bar graphs (for Year 3).
- Have students practise using ‘I notice’ statements that include the variable name and context when describing data visualisations.
- Explain and demonstrate ‘reading the data’ and ‘reading between the data’.
- Explain how to describe features of data visualisations (e.g., frequency, the least/most frequent category, modes or modal groups, highest and lowest values).
Curriculum document statements:
- Answering questions about data visualisations, including which category has the most or least items and questions involving operations (e.g. How many teeth did our class lose in total?)
- Data visualisations are representations that help reveal the story of a set of data.
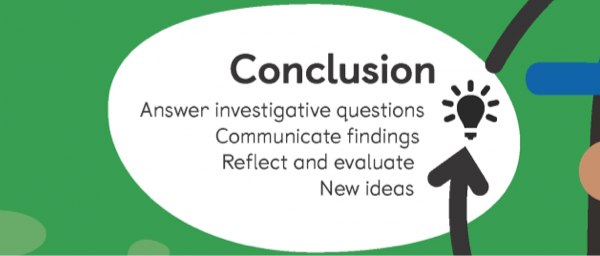
OUR COMMENTARY
These curriculum statements also speak to the PPDAC cycle, and the need to answer our original investigative question. The statistical enquiry process allows students to engage in a statistical problem solving process to find out about a situation. By undertaking a statistical enquiry students end up with new knowledge about the world, and potentially more investigative questions.