News › 2015

Christine (Chris) Franklin University of Georgia Athens, GA USA presented to Mathematics associations around New Zealand. She is a 2014-15 Fulbright Scholar and is spending five months at the University of Auckland, New Zealand working with statistics educators on the project, “Implementing K-12 Statistics Standards: Comparing Practices in New Zealand and the United States”.

Below is an audio recording of her presentation to the Wellington Mathematics Association, May 2015:

Abstract:

The United States is realizing the need to achieve a level of quantitative literacy for its high school graduates to prepare them to thrive in the modern world. Given the prevalence of statistics in the media and workplace, individuals who aspire to a wide range of positions and careers require a certain level of statistical literacy. Because of the emphasis on data and statistical understanding, it is crucial for us as educators to consider how we can prepare a statistically literate population. Students must acquire an adequate level of statistical literacy through their education beginning in the first grade of education.

The Common Core State Standards for mathematics (that include statistics) in grades Kindergarten – 12 have been adopted by the most states and the District of Columbia. These national standards for the teaching of statistics and probability range from counting the number in each category to determining statistical significance through the use of simulation and randomization tests.

This presentation will provide a brief history of statistics at K-12 in the U.S., an overview of the statistics and probability content of these common core standards, resources that support the K-12 standards in statistics, describe the knowledge and preparation needed by the future and current K–12 teachers who will be teaching using these standards, and the desired assessment of statistics at K-12 on the high stakes national tests will be explored.

Chris is the Lothar Tresp Honoratus Honors Professor and Undergraduate Coordinator in Statistics at the University of Georgia and a Fellow of the American Statistical Association. She has been recognized with numerous teaching and advising awards at UGA. She is the co-author of an Introductory Statistics textbook with Alan Agresti (Pearson 2012), co-author of the textbook Statistics Reasoning in Sports with Josh Tabor (Freeman 2012) and has published more than 50 journal articles. Chris was the lead writer for the American Statistical Association Pre-K-12 Guidelines for the Assessment and Instruction in Statistics Education (GAISE) Framework. She chaired the writing team of the recent ASA Statistical Education of Teachers (SET) report.

School students think verbal mistreatment is the biggest bullying issue in schools – higher than cyberbullying, social or relational bullying such as social exclusion and spreading gossip, or physical bullying.

The insights have emerged from the long-running CensusAtSchool/TataurangaKiTeKura, a national statistics education project for primary and secondary school students. Supervised by teachers, students aged between 9 and 18 (Year 5 to Year 13) answer 35 questions in English or te reo Māori about their lives, then analyse the results in class.

Already, more than 18,392 students from 391 schools all over New Zealand have taken part in CensusAtSchool, which started on March 16. (Click here to see which of your local schools are taking part).

Students were asked how much they agreed or disagreed with statements about each type of bullying.  A total of 36% strongly agreed or agreed that verbal bullying was a problem among students at their school, followed by cyberbullying (31% agreed or strongly agreed), social or relational bullying (25% agreed or strongly agreed) and physical bullying (19% agreed or strongly agreed).

This is the first time CensusAtSchool has asked about bullying, says Ōtāhuhu College teacher Anne Patel, a member of the CensusAtSchool team. “Information about the scale of bullying is hard to get in New Zealand because we don’t have a way of quantifying it on a national level.  But as CensusAtSchool is anonymous and available to students in every school in the country, we are getting a unique student-eye view of its scale and prevalence.”

Looking more closely at each category:

Verbal bullying

  • Overall, 36% of schoolchildren who took part strongly agreed or agreed that verbal bullying was a problem at their school.
  • Verbal bullying was more of a problem in high schools (39% of students agreed or strongly agreed) than primary schools (29%).
  • Verbal bullying was more of a problem for girls in co-ed schools (43% strongly agreed or agreed) than girls in single-sex schools (33% strongly agreed or agreed).

Cyberbullying

  • Overall, 31% of students who took part strongly agreed or agreed that cyberbullying was a problem at their school.
  • Girls were more likely to say cyberbullying was a problem at school (34% strongly agreed or agreed) than boys (26% strongly agreed or agreed).
  • Cyberbullying was more of a problem in high schools. A total of 19% of boys at primary school strongly agreed or agreed that bullying was a problem in their schools, but 31% of boys at high school. A total of 22% of girls at primary school strongly agreed or agreed that cyber-bullying was a problem in their school, but 40% of girls at high school.
  • For boys, cyber-bullying was more likely to be a problem in co-educational settings: A total of 32% of boys in co-ed schools strongly agreed or agreed that cyber bullying was a problem, against 23% of boys in single-sex schools. However, the picture was quite different for girls. A total of 40% of girls in co-ed schools strongly agreed or agreed that cyber bullying was a problem in their school, and the corresponding figure for girls in single-sex schools was also 40%.

And who were cyber bullies? Overall, 69% of all students who took part said that cyberbullies were equal numbers of boys and girls.

Social/relational bullying

Overall, 25% of students who took part strongly agreed or agreed that social/relational bullying was a problem at their school.

Physical bullying

  • Overall, 19% of students who took part said physical bullying was a problem at their school.
  • Physical bullying was more of an issue for boys (22% agreed, strongly agreed) than girls (16%).
  • Physical bullying appeared to be a bigger problem for boys at co-ed schools (24% strongly agreed or agreed) than at single-sex boys’ schools (16%).
    However, physical bullying was seen to be bigger problem in the eyes of girls in co-ed schools (17% strongly agreed or agreed that physical bullying was a problem at their school), than those in single-sex schools (9%).

Anne Patel says of particular interest is the data showing that students in single-sex schools were less likely to report bullying as a problem. “The question we now need to ask is: why this is? What is it about these schools that students perceive bullying to be less of a problem?”

CensusAtSchool, now in its seventh edition, is a collaborative project involving teachers, the University of Auckland’s Department of Statistics, Statistics New Zealand and the Ministry of Education. It is part of an international effort to boost statistical capability among young people, and is carried out in Australia, the United Kingdom, Canada, the US, Japan and South Africa. The countries share some questions so comparisons can be made, but the majority reflect New Zealand students’ interests.

Articles and updates on all aspects of Mathematics and Statistics for teaching and learning.

Professional reading for middle managers and teachers.

Updates to Statistics standards on page 4:

Experiments: AS91265 AS91538

Bivariate data: AS90136 and AS91581


Secondary Mathematics and Statistics Newsletter Term 2 2015

Be part of giant graphs and visual data representations, stretching across the fields of Wellington’s Macalister park. Artist Siv B Fjærestad is working with public art producers Letting Space, in partnership with Wellington City Council to create a data inspired artwork on the fields of Macalister and Liardet Street Parks, Berhampore: a dynamic backdrop for activity.

Now all they need is you! Opening Public Picnic Sunday 19 April 2015 12-3pm for a programme of family events and a community picnic.

Over 2013 Fjærestad and volunteers surveyed the local community to inform the painting’s design and use.  Fjærestad states “The painting design contains representations of statistical data and ideas for the park collected from the community, visual references to current activity and also to the landscape and its history. The park is perceived, used and interpreted differently at different times of the day and week. This work involves contributions from local communities, sporting groups and businesses, and extends what we consider both painting and public art to comprise. It asks questions about how we use our city public commons.” The paintings are for the public to look at and play on, encouraging leadership from the community to value the park as a public good.

When: Monday 20th April

Where: MacAlister Park, Newtown, Wellington

Ticket Information:

  • Admission: Free

Website:

Projected Fields has been funded by Wellington City Council’s Public Art Fund.

NZCER has just released a book titled Mathematics and Statistics in the Middle Years: Evidence and Practice, edited by Robin Averill.

There are two chapters that draw specifically on Statistics Education (Arnold & Pfannkuch, and Sharma et al.) Other chapters have pedagogical ideas which are useful for teachers of Statistics. Most chapters have been partnerships between academics and teachers, and all are grounded in practice and research.

Years 7-10 are the main focus area but many of the ideas are transferable above and below these years.

These readings could be useful to new teachers, who would benefit from an overview of how Statistics education in New Zealand has developed in the past decade.

Learn more


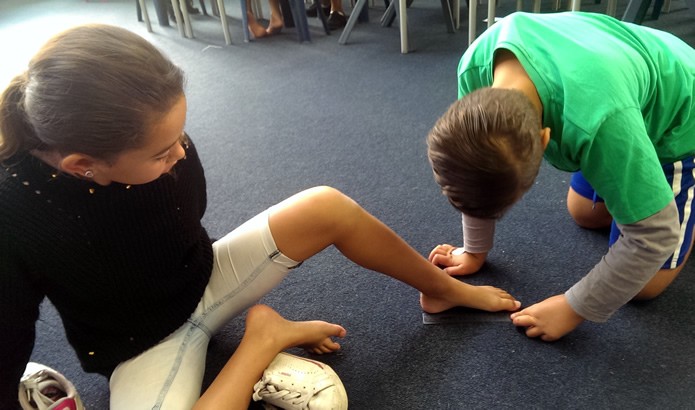
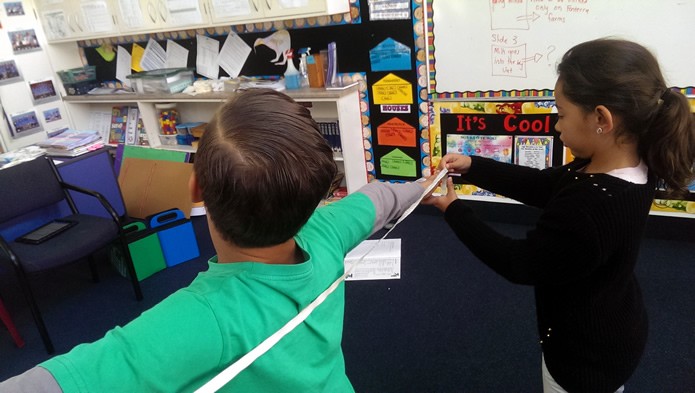
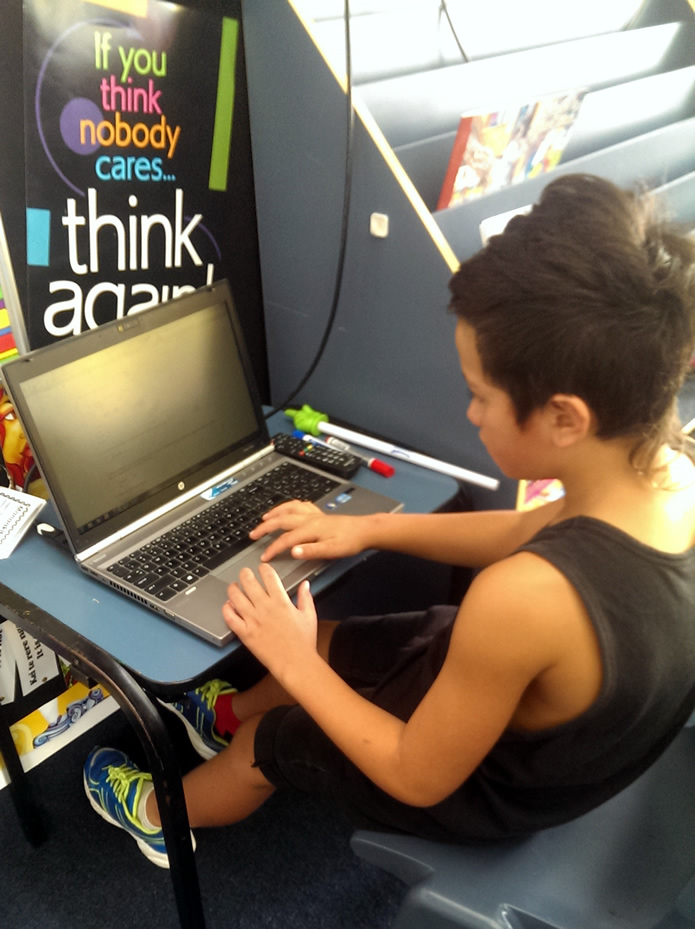
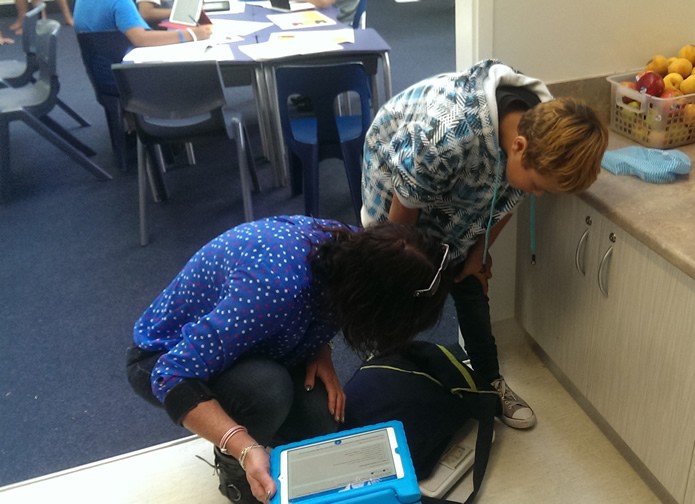
CensusAtSchool 2015 photos

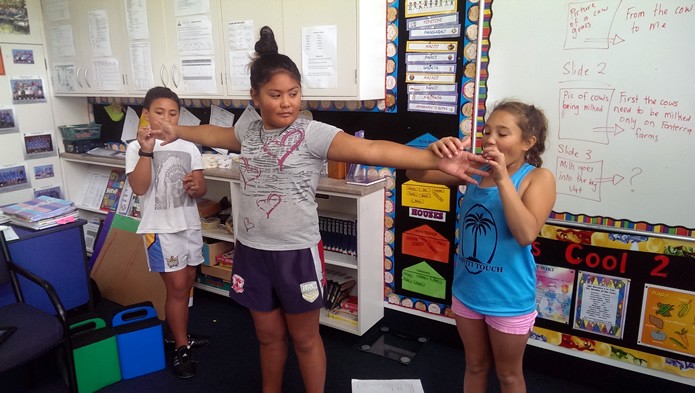
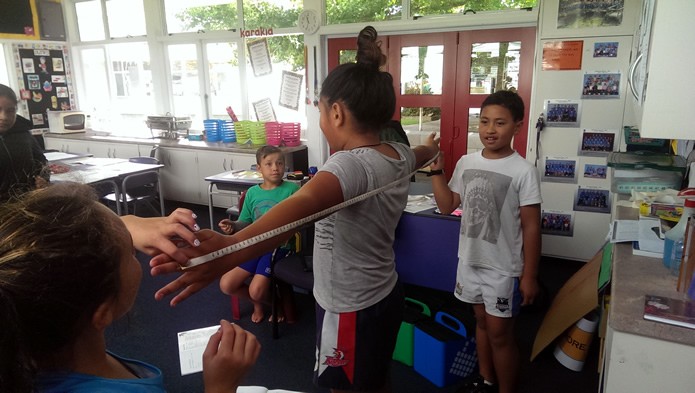
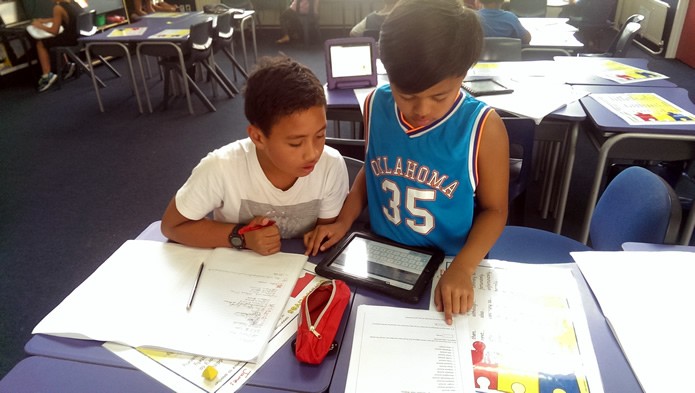
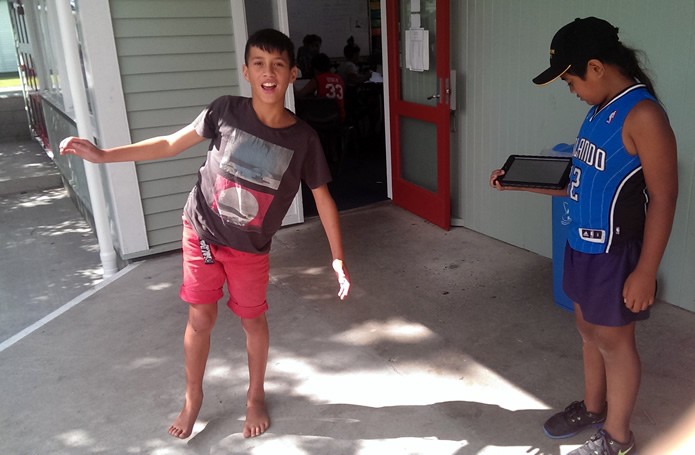
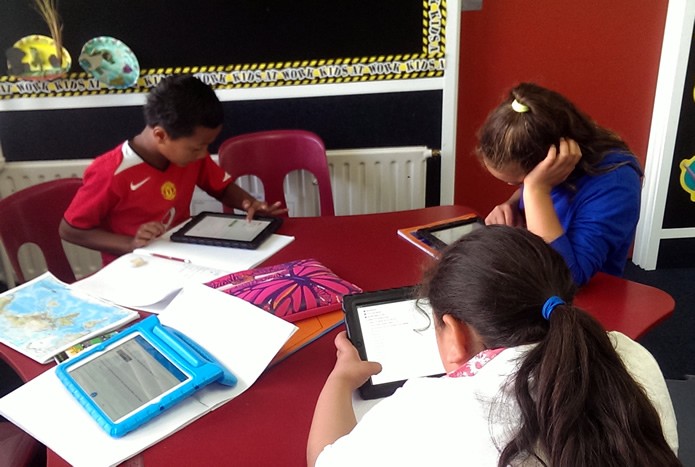
Here’s some beautiful photos of tamariki in Room 2 at Strathmore School taking part in CensusAtSchool 2015:

IMAG2879IMAG2865IMAG2868 IMAG2872IMAG2870  IMAG2874IMAG2875IMAG2864IMAG2871    IMAG2877
Thanks to Whaea Rachel Rawiri for sending these in!

Singer and The X-Factor New Zealand judge Stan Walker is Kiwi kids’ favourite local celebrity by far, according to the first insights to emerge from CensusAtSchool/TataurangaKiTeKura, the only national survey of what schoolchildren are thinking, feeling and doing.

Walker, 24, who shot to fame after winning Australian Idol in 2009, was way ahead of any other local celebrities after day three of CensusAtSchool/TataurangaKiTeKura, a long-running, online educational project that brings statistics to life in the classroom. Supervised by teachers, students aged between 9 and 18 (Year 5 to Year 13) answer 35 questions in English or te reo Māori about their lives, then analyse the results in class.

CensusAtSchool/TataurangaKiTeKura was launched on Monday morning, and by 5pm on Wednesday, more than 2,500 students had taken part.

Among the questions they answered was “Who is your favourite New Zealand celebrity?”, and they could name anyone. Many said they didn’t have a particular favourite, but among those who did, Walker, of Tūhoe and Ngāti Tūwharetoa, picked up 25% of the votes. Second was Auckland singer Lorde, 18, whose 2013 debut single, Royals, was an international hit. She got 21% of the vote.

CensusAtSchool/TataurangaKiTeKura co-director Rachel Cunliffe, an online communications and youth culture specialist, says that Stan Walker’s talent, coupled with his sincerity and positive nature, makes him very appealing to children and young people. “Stan Walker rose above a really rough childhood, and that’s inspirational. He’s also a role model – he was campaigning against bullying long before it became a huge issue on The X Factor New Zealand this week.”

Rachel Cunliffe says that Lorde’s appeal lies not only in her music, but in her refusal to be anything other than herself.  “She’s a positive, strong, empowering personality.”

More than 1,700 teachers from 834 schools all over New Zealand have registered for CensusAtSchool, which started on Monday, March 16 and runs until May 29. (Click here to see which of your local schools are taking part).

CensusAtSchool, now in its seventh edition, is a collaborative project involving teachers and the University of Auckland’s Department of Statistics, with support from Statistics New Zealand and the Ministry of Education. It is part of an international effort to boost statistical capability among young people, and is carried out in Australia, the United Kingdom, Canada, the US, Japan and South Africa. The countries share some questions so comparisons can be made, but the majority reflect New Zealand students’ interests.

CensusAtSchool on Te Kāea


Watch this video featuring Sue Hodge from Elm Park school in Pakuranga and Julie Middleton from the CensusAtSchool team on Te Kāea, Māori Television’s news show, on March 17.

The Ministry of Education and Statistics NZ are encouraging teachers to sign up to CensusAtSchool, an online statistics project that turns students into “data detectives”.

Students aged 9 to 18 (Year 5 to Year 13) use a variety of digital devices to answer 35 online questions in English or te reo Māori about their lives and opinions.

Students answer questions such as: Where did you eat your dinner last night? Is bullying among students a problem at your school? About how many txt messages did you send yesterday? Which two teams will contest the Rugby World Cup final? They are also asked to carry out activities such as weighing their schoolbag.

Ministry of Education Deputy Secretary for Student Achievement Dr Graham Stoop says more than 1600 teachers from over 800 schools are taking part in CensusAtSchool in their maths and statistics classes from March 16 until May 29. The data will then be released for classroom analysis.

“Students love becoming ‘data detectives’. This is a fun and engaging way for them to learn about the relevance of statistics to everyday life. CensusAtSchool is linked to the national statistics curriculum, so we encourage teachers in primary and secondary schools to take part,” says Dr Stoop.

The project is run every two years by the University of Auckland’s Department of Statistics, with support from Statistics NZ and the Ministry of Education.

Statistics NZ’s education manager Andrew Tideswell says statistical literacy is essential in a data-driven world. “Students with strong statistical skills are not only in demand in the workplace, they’re in a position to make informed decisions about the data around them every day.”

New Zealand schoolchildren will share their thoughts on bullying in a nationwide survey that launches this week.

CensusAtSchool/TataraungaKiTeKura is a long-running, online educational project that brings statistics to life in the classroom. Supervised by teachers, students aged between 9 and 18 (Year 5 to Year 13) answer 35 questions in English or te reo Māori about their lives, then analyse the results in class.

Already, more than 1618 teachers from 808 schools all over New Zealand have registered for CensusAtSchool, which runs from March 16 to May 29. (Click here to see which of your local schools are taking part).

For the first time, children will be asked for their opinions on bullying. CensusAtSchool co-director Rachel Cunliffe says the questions were developed in response to calls for greater discussion of the issue, which has been identified as a major problem in New Zealand.

“Bullying of any type – whether its verbal bullying or cyber-bullying – can have a huge and negative impact on children’s learning,” she says. “And as statistics is about recording what happens in real life, we have an opportunity to hear what children really think about the problem and, hopefully, encourage greater discussion of bullying.”

The bullying questions are as follows: Is bullying among students a problem at your school? When did you first personally experience or become aware of bullying behaviour? Who do you think are cyberbullies? How old do you think cyberbullies are?

Other questions in the survey this year ask students to undertake practical activities such as weighing their schoolbag, and paint a picture of their lifestyle through questions such as: Where did you eat your dinner last night? About how many txt messages did you send yesterday?

CensusAtSchool, now in its seventh edition, is a collaborative project involving teachers and the University of Auckland’s Department of Statistics, with support from StatisticsNZ and the Ministry of Education. It is part of an international effort to boost statistical capability among young people, and is carried out in Australia, the United Kingdom, Canada, the US, Japan and South Africa. The countries share some questions so comparisons can be made, but the majority reflect New Zealand students’ interests.

Notes to media
Contact
CensusAtSchool co-director Rachel Cunliffe at censusatschoolnz@gmail.com or phone 027 3833 746. For more information on CensusAtSchool New Zealand 2015, visit http://www.censusatschool.org.nz. To find out which of your local schools are participating, click here.  To see the questions, click here.

About CensusAtSchool co-director Rachel Cunliffe
Rachel holds a BSc (Hons) in Statistics from the University of Auckland and co-directs CAS with Professor Chris Wild of the Department of Statistics at The University of Auckland. Rachel owns web company cre8d design and speaks about online communications and youth culture. To download a free high-resolution picture of Rachel, click here.