See the live dashboard for CensusAtSchool 2023-2024

News

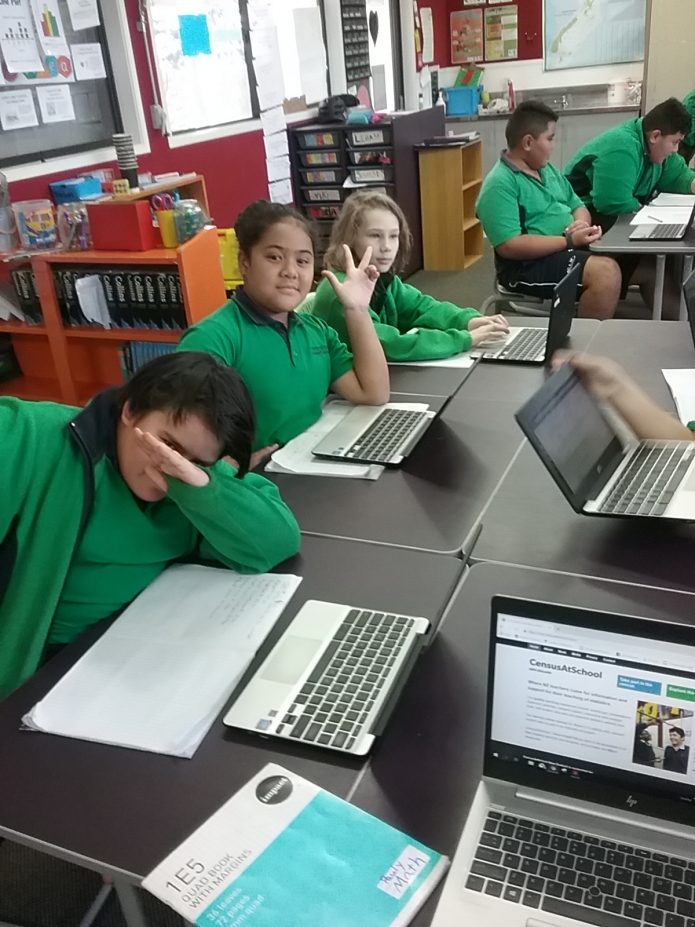
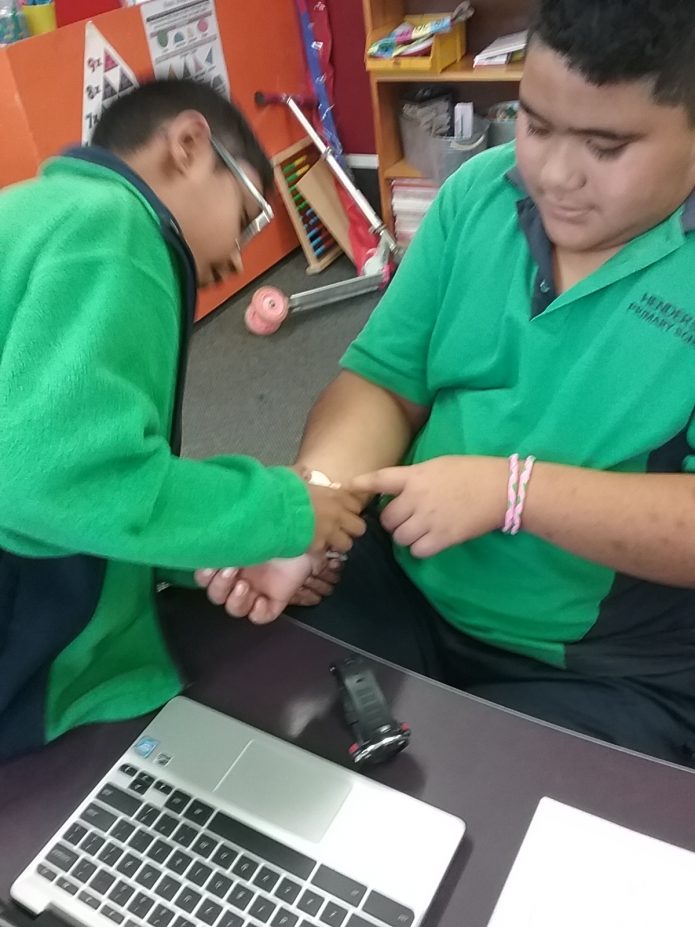
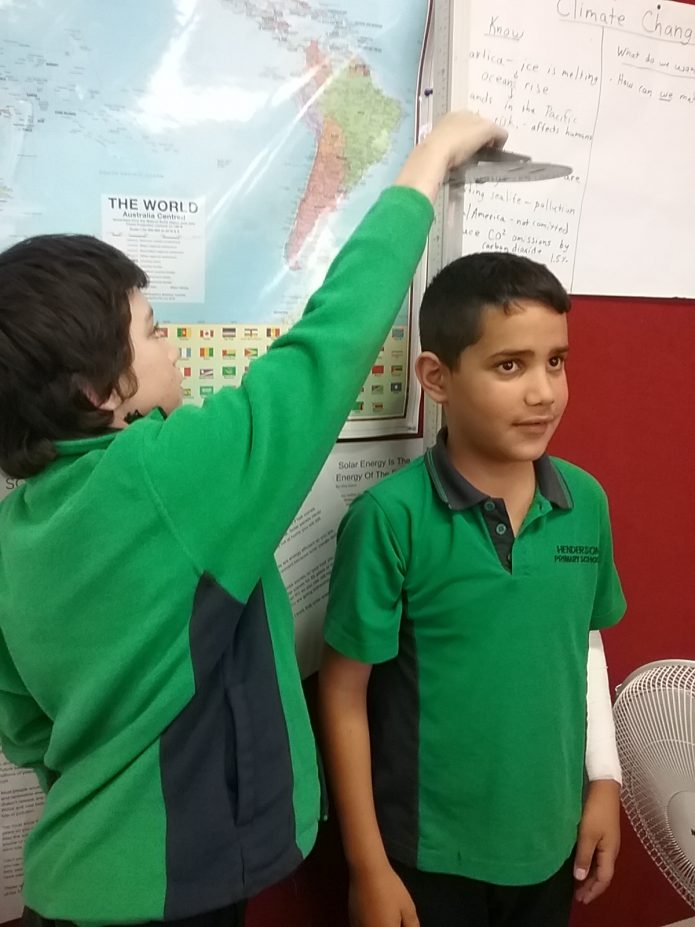
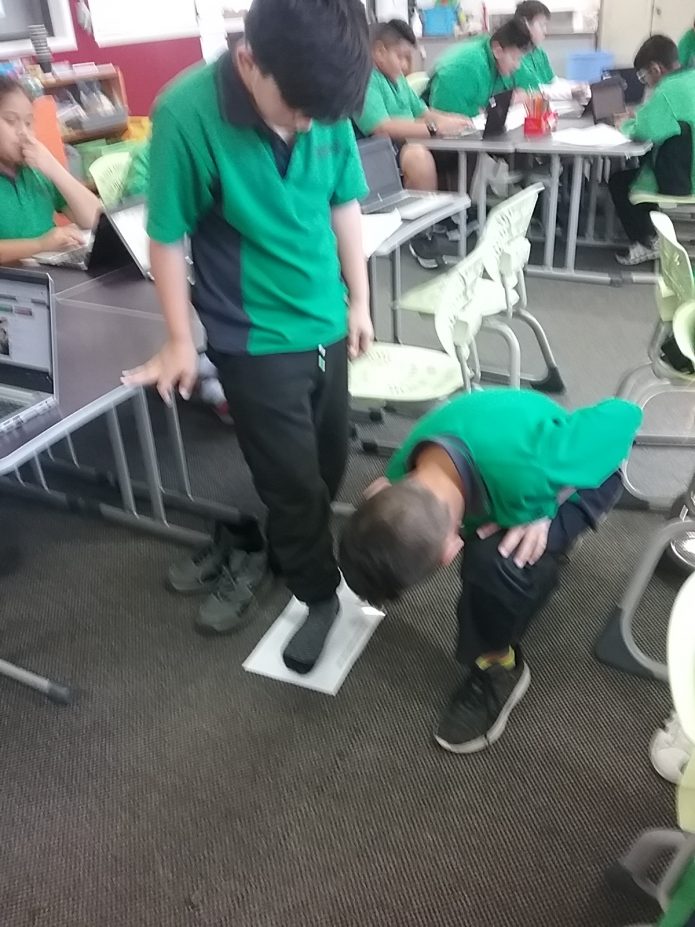
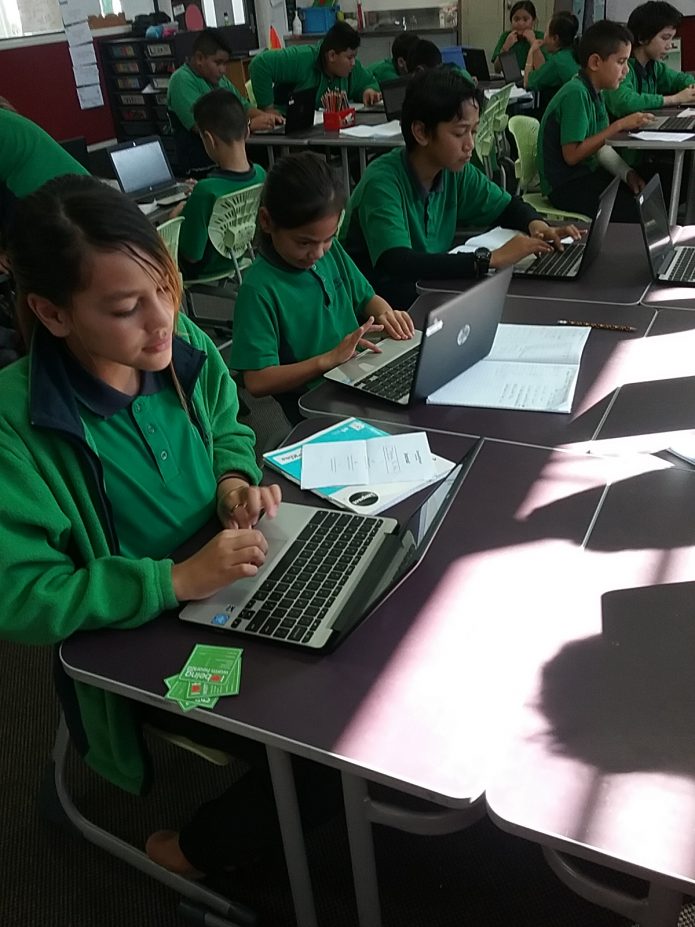
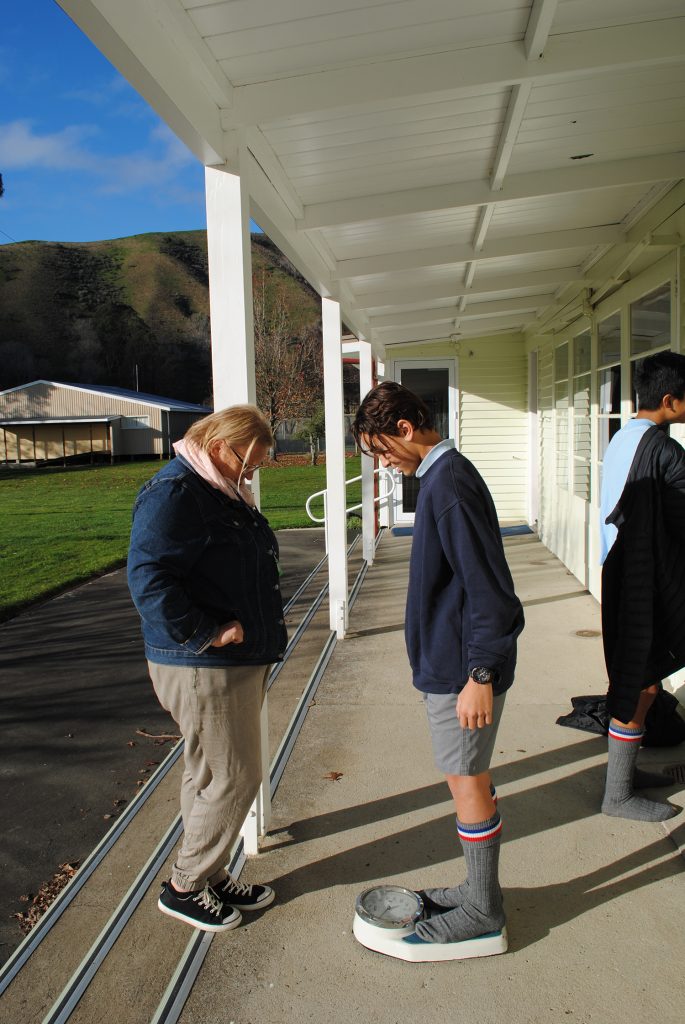
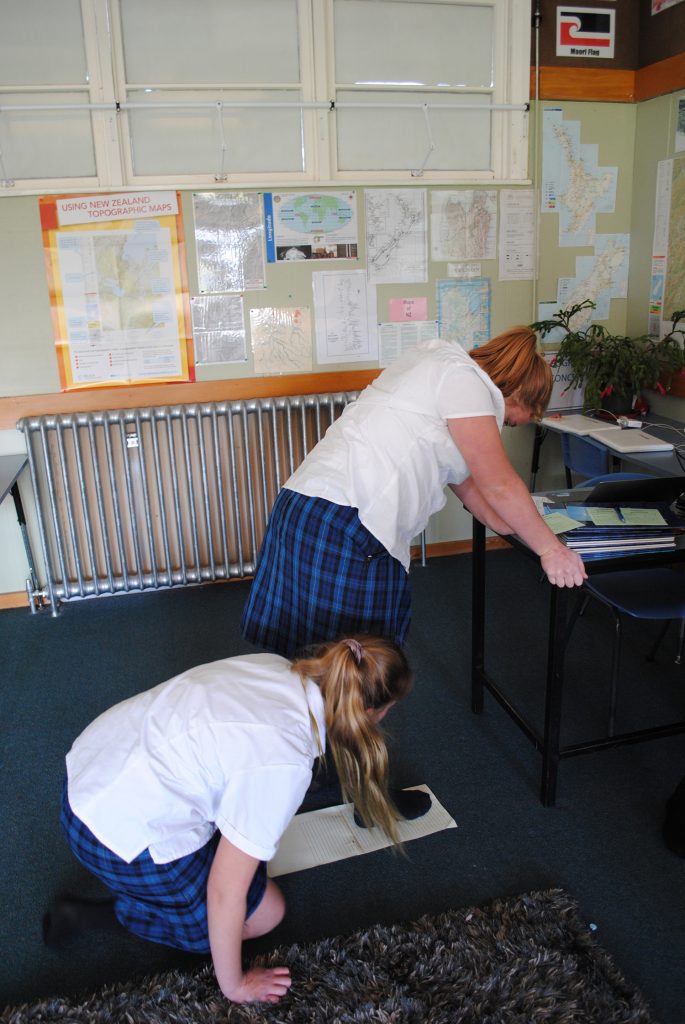
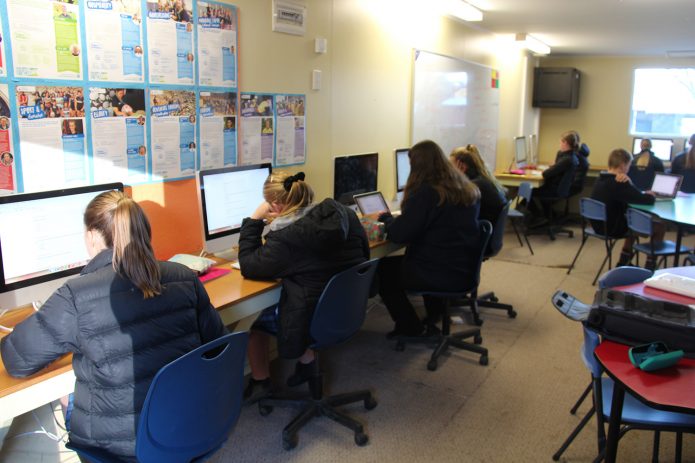
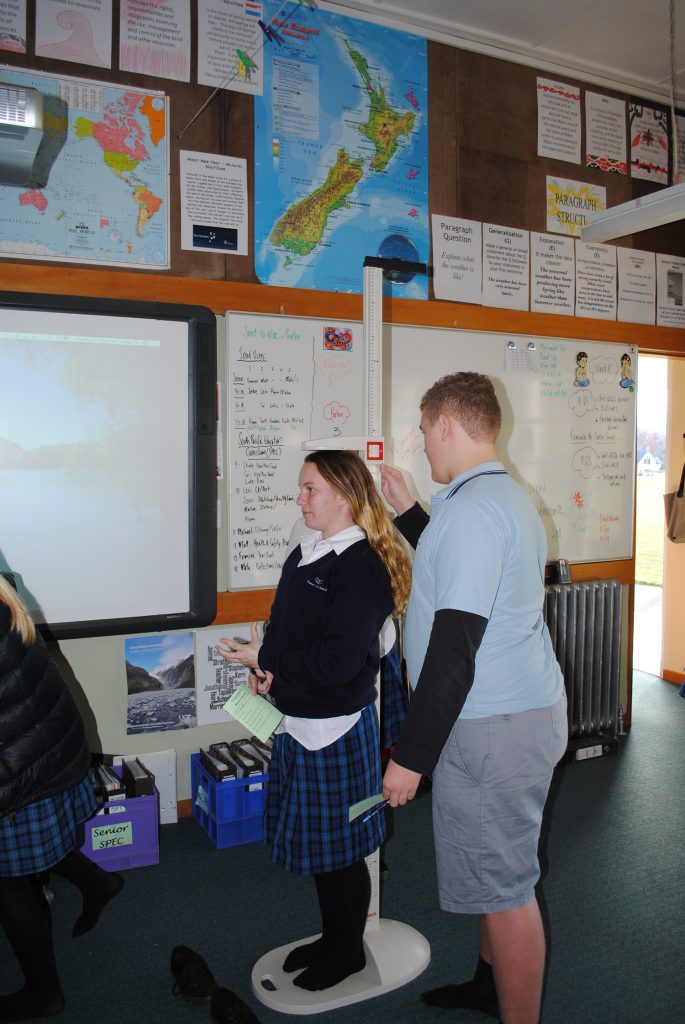
Thanks to Michelle Dalrymple of Cashmere High School for sharing these photos of her Year 9 class taking part in CensusAtSchool.

Our press release with insights into our students’ school lunches received a range of media coverage, including:

Press release: May 2, 2017

School tuck shops are losing ground to home-packed lunches, according to latest results from the long-running CensusatSchool TataurangaKiteKura. In the past 10 years, the percentage of students buying lunches from tuck shops has halved.

Overall, 86% of primary and secondary school students brought their lunch from home on the day they responded to the survey, with just 5% buying from the tuck shop. When the same question was asked a decade ago, 79% were bringing lunch from home and 10% buying at their school’s tuck shop.

CensusAtSchool TataurangaKiTeKura is a national, biennial project run by the University of Auckland’s Department of Statistics that shows children the relevance of statistics to everyday life. In class, Year 5 to Year 13 students (aged 9 to 18) use digital devices to answer 35 online questions in English or te reo Māori, providing a unique snapshot of Kiwi childhoods. So far, more than 10,000 students have taken part, and they have answered several questions on food.

The Census asked “Where did you get your lunch from today?” with the possible answers “home” (overall 86%; primary 93%; high school 78%); “a shop on the way to school” (overall 3%; primary 2%; high school 3%); “the school shop” (overall 5%; primary 3%; high school 7%); “a friend at school” (overall 0.5%; primary 0.2%; high school 1%); “provided by my school” (overall 2%; primary 1%; high school 4%); and “don’t have any” (overall 3.6%; primary 1%; high school 7%).

The backdrop is growing childhood obesity and much public debate over what kids should be eating at school. An Education Review Office report released just before Easter found that most schools were doing a good job equipping young people to make good food choices, but acknowledged that factors such as family finances and attitudes, student price sensitivity and takeaway shops near schools could prevent children bringing or choosing good-quality lunches. Many school-run tuck shops lost money, so schools often contracted out to providers who “were profit-driven, and tended to be most interested in stocking what would sell well; not usually the healthy options”.

CensusAtSchool co-director Rachel Cunliffe, who has two school-aged children, says that she wonders if public discussions have raised parents’ awareness of the importance of the school lunches they provide, and that this has led to more concerted efforts to provide packed lunches. Mrs Cunliffe makes her two primary school-aged children daily packed lunches, and once a term they are allowed to buy lunch at school: “Of course, they tell me that everyone else gets to buy their lunches all the time.”

The past few years has also brought publicity about some school children going without breakfast or lunch, and Mrs Cunliffe says she was “relieved” that the number of children reporting that they had no lunch was fewer than expected. “That said, you don’t want to think that any students are going hungry,” she says. “I am hoping that the 7% of high-school students not having any lunch is because they didn’t get their act together to prepare it. A packed lunch does take some forethought and preparation.”

The Census also asked children who brought packed lunches how many items grown at home were among the food provided that day. A quarter said they had at least one home-grown item in their lunchbox.

This year’s edition of CensusAtSchool TataurangaKiteKura started on February 7. Teachers can register their classes and take part at any time before it finishes on July 7. The Census is part of an international effort to boost statistical capability among young people, and is carried out in Australia, the United Kingdom, Canada, the United States, Japan and South Africa.

The countries share some questions so comparisons can be made. In New Zealand, the Census started 2003, and is run by the University of Auckland’s Department of Statistics with support from Statistics NZ and the Ministry of Education.

Dear Awesome Teacher of Statistics

Have you heard of the Teaching Statistics Through Data Investigation MOOC for Educators? We continue to serve teachers from across the globe and have over 400 participants in the current session (open until June 30, 2017). Need a refresher? join us–it is still free!

Yearning for more??? Well I’d like to share a few opportunities and resources.

1. We will launch a SECOND Teaching Statistics course Fall 2017!  This course is a follow-up to TSDI and specifically focuses on Teaching Statistics Through Inferential Reasoning.  See the course description and outline here. If you have a favorite task, or online app, or video or other resource that helps you teach students to reason about using data and statistical ideas to make generalizations (informally or formally) beyond the data, we would love to feature some of your ideas in the new course (credited to you of course!)!  Please complete this brief form and upload (or provide links to) your favorite resources.

2. Learn about our new initiative for being a Hub for Innovation and Research in Statistics Education [http://hirise.fi.ncsu.edu/] and join our Facebook community so we can stay connected. https://www.facebook.com/groups/hirise.fi/

3. If you have not seen the Stats4Stem website, check it out!  It is a fantastic website full of resources for statistics teachers and their students to assist with teaching, learning, and assessment in statistics. http://www.stats4stem.org/

4. Want a free online tool for exploratory data analysis! Check out the ever-improving CODAP tool at http://codap.concord.org/

5. If you are interested in pursuing a graduate degree in statistics or mathematics education at NC State, check out  our PhD and Masters degrees! Not able to move to Raleigh?? Then consider the 12 credit (4 classes) online graduate certificate in Statistics Education! I’d love to continue learning with you!

Thank you for your continued commitment to making the world a better place through statistics and data literacy. Together we make a difference.

Many Smiles,

Hollylynne Lee

Professor, Mathematics and Statistics Education
University Faculty Scholar
Department of Science, Technology, Engineering, and Mathematics Education
Faculty Fellow, Friday Institute for Educational Innovation
NC State University

Waitara Central School


Waitara Central School

Waitara Central School

Thanks to Oron Smith of Waitara Central School for sharing these photos of his class taking part in CensusAtSchool.

Thanks to Claire Cheeseman at Langholm School for sending through these lovely photos of her students taking part in CensusAtSchool:

CensusAtSchool CensusAtSchool CensusAtSchool

Our press release with insights into our students’ screen time received a range of media coverage, including:

Eight in 10 teens and six in 10 primary school children say there are no limits on their screen time out of school – whether that’s playing computer games, using their phones, or browsing the internet.

The insights have emerged from the second data release from CensusAtSchool TataurangaKiTeKura, a national, biennial project run by the University of Auckland’s Department of Statistics that shows children the relevance of statistics to everyday life. In class, Year 5 to Year 13 students (aged 9 to 18) use digital devices to answer 35 online questions in English or te reo Māori, providing a unique snapshot of Kiwi childhoods. So far, more than 5,700 students have taken part.

Students were asked if, on a school day, there was a limit on the amount of screen time they had at home. Just 16% of high-school students and 37% of primary school students reported a limit. For those with limits, primary schoolers were allowed a median of an hour (the median is the middle amount in the range reported) and secondary students two hours.

Students were asked how often their screen time was supervised – with supervised meaning a parent or caregiver was watching or was in the same room as the child. Four in 10 primary schoolers said “a little,” and two in 10 “usually.” More than half of high school students said they were never supervised, with a further three in 10 saying they were supervised “a little.”

CensusAtSchool co-director Rachel Cunliffe, a former statistics lecturer and mother of four children aged 2, 4, 6 and 8, says she is “really surprised” at the results. “I imagined that in this completely wired world, the majority of kids would have limits – parents often discuss ways to find a balance between screen time and outdoor play time.”

Rachel Cunliffe points to Ministry of Health advice that outside of school, 5 to 18-year-olds spend less than two hours a day in front of the television, computers, and game consoles. She and her husband tried setting limits, but with four kids, that was hard to police. “Now, in our house, we have a list of morning, afternoon and evening jobs to be done on school days before the kids are allowed screen time, “ she says.

“By the time they’ve done everything expected of them, and their out-of-school school activities like swimming and karate, there’s not often long periods of time left for gaming. My eight-year-old has been pretty motivated to get through his jobs, and can get in an hour on the Playstation or tablet sometimes.”

So how are other school children using their screen time? Seven in 10 students said they spent time on their phone. Of that group, the most avid users were high school girls with 89% on their phones once school was out, and for a median of three hours – though a quarter spent 5 hours 30 minutes or more.

Four in ten students said they spent time gaming after school, with the keenest gamers high school boys. They spent a median of two hours in front of their Playstation, Xbox, Nintendo and the like – but a quarter spent four hours or more gaming.

CensusAtSchool also asked students what they did most often with their cellphones. Primary school boys reported playing games (27%) and primary school girls sending texts or instant messages (32%). At high school, it was all about social media for both girls (49%) and boys (31%).

This year’s edition of CensusAtSchool started on February 7. Teachers can register their classes and take part at any time before it finishes on July 7. CensusAtSchool is part of an international effort to boost statistical capability among young people, and is carried out in Australia, the United Kingdom, Canada, the United States, Japan and South Africa.

The countries share some questions so comparisons can be made.
In New Zealand, CensusAtSchool started 2003, and is run by the University of Auckland’s Department of Statistics with support from Statistics NZ and the Ministry of Education.

Thursday, March 16, 2017 12:00:00 PM NZDT – 1:00:00 PM NZDT

What can we learn from large-scale national and international assessments? NCTM President Matt Larson will discuss in more detail his January President’s Message. Join us  as he provides a combined analysis of the results from the National Assessment for Educational Progress (NAEP) scores, the Trends in Mathematics and Science Study (TIMSS), and the 2015 Programme for International Student Assessment (PISA), and recommends actions that we can take together.

Register here for free at NCTM

Our press release with insights into our students’ pocket money received a range of media coverage, including: