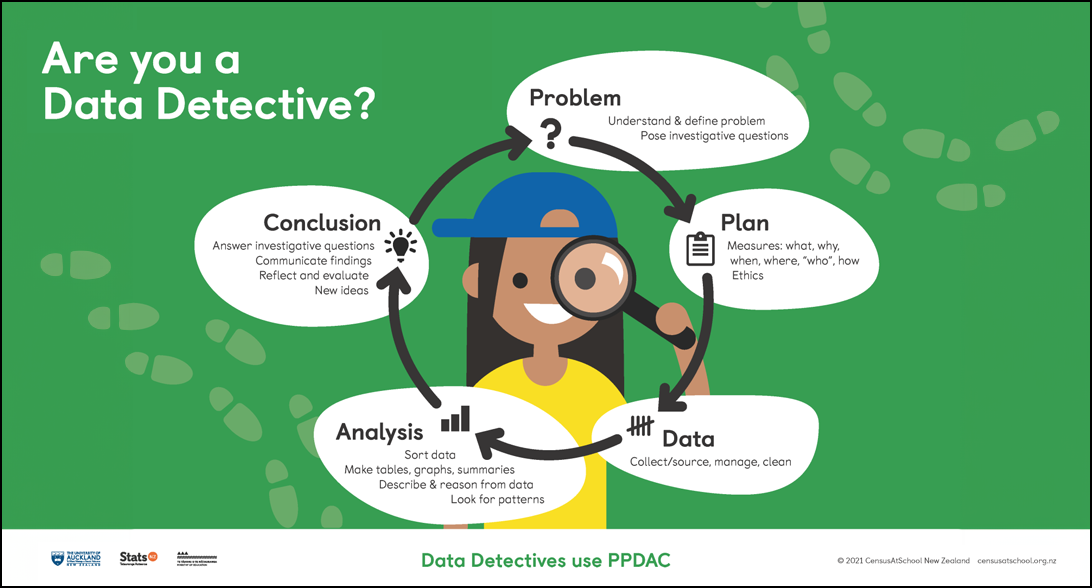
Last week, we wrote to reassure you that the PPDAC cycle is still a key part of teaching and learning statistics in New Zealand classrooms. It remains the glue that holds it all together.
We covered what this means in practice for Year 3 level statements. This week, we’re looking at Year 9.
Using the PPDAC cycle in Year 9
When planning to teach statistics in Year 9, you will need to consider the Year 9 level statements. In the example below, we show how they connect with the PPDAC cycle to support the great work teachers are already doing in teaching statistics in high schools.
Remember: The curriculum statements cover what students need to know, not how to teach them.
Curriculum document statements:
- Multivariate data is data in a set that has more than two variables.
- Data can be collected from observational studies in which the observers do not alter or control the behaviour of the subjects.
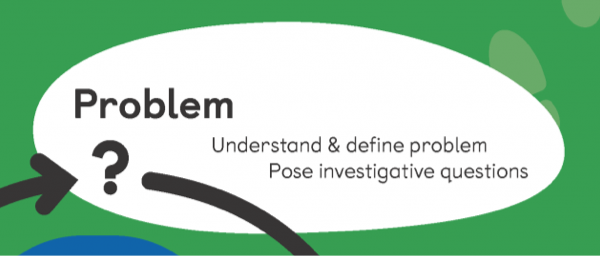
- Statistical [INVESTIGATIVE] questions clearly identify the variable, group of interest, and the intent of an investigation.
- A summary investigation is about a group.
- A comparison investigation compares a [numerical] variable across two clearly identified groups.
- A relationship investigation looks for a connection between paired numerical or paired categorical variables.
- A time-series investigation looks at a [numerical] variable over time.
- Primary data is data that is collected first-hand.
- Secondary data is data collected by someone else.
OUR COMMENTARY
These curriculum statements clearly indicate that students are undertaking statistical investigations. Teaching and learning can come from a range of summary, comparison, relationship, and time series investigations.
We have clarified that the statistical question discussed in the third bullet point is the investigative question. Other statistical questions include survey or data collection questions, analysis questions, and interrogative questions. The investigative question is the statistical question we want to answer using data.
Students are working with multivariate datasets, and the focus is on observational studies. Students will be planning to collect primary data and find out about secondary data collected by someone else in order to pose and answer investigative questions.
In this phase of the investigation, students should be making initial conjectures or assertions about what they expect to find, not explicitly stated here, but referenced in the conclusion section “Comparing findings to initial conjectures or assertions and existing knowledge”.
Curriculum document statements:
- Primary data is data that is collected first-hand.
- Secondary data is data collected by someone else.
- Planning and collecting multivariate data to respond to a statistical INVESTIGATIVE question and where at least one variable is categorical and at least one is numerical
OUR COMMENTARY
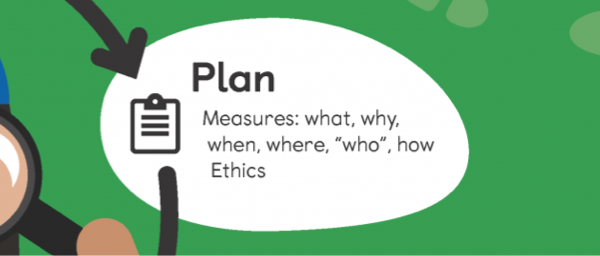
These curriculum statements indicate that students are planning to collect data, and are collecting data. Ideally, the dataset is multivariate, so not just one variable, and the dataset should have at least one categorical variable and one numerical variable. To explore time series and relationship investigative questions, students will need at least two categorical (relationship) and at least two numerical (relationship and time series, one of which is time). We strongly recommend working with larger multivariate datasets, as they provide students with more individual choice about which variables they will investigate.
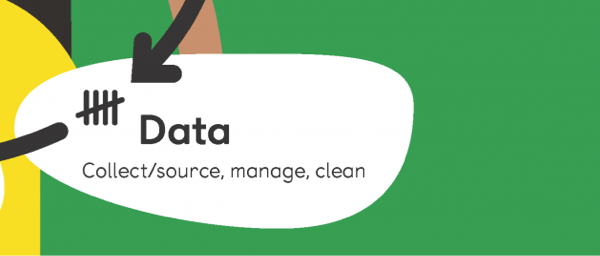
The statements also indicate that students are working with secondary data, such as the data that is available on CensusAtSchool and many other data repositories (see the Data Gems document on CensusAtSchool for a longer list, and teachers can also access the list in the book Statistical investigations | Te tūhuratanga tauanga Chapter 4 – sourcing datasets pp 162-167). It is good to remember that the PPDAC cycle can start at any point, and with secondary data, often the investigation starts with the data, interrogating the original investigator’s “plan” before posing investigative questions for exploration.
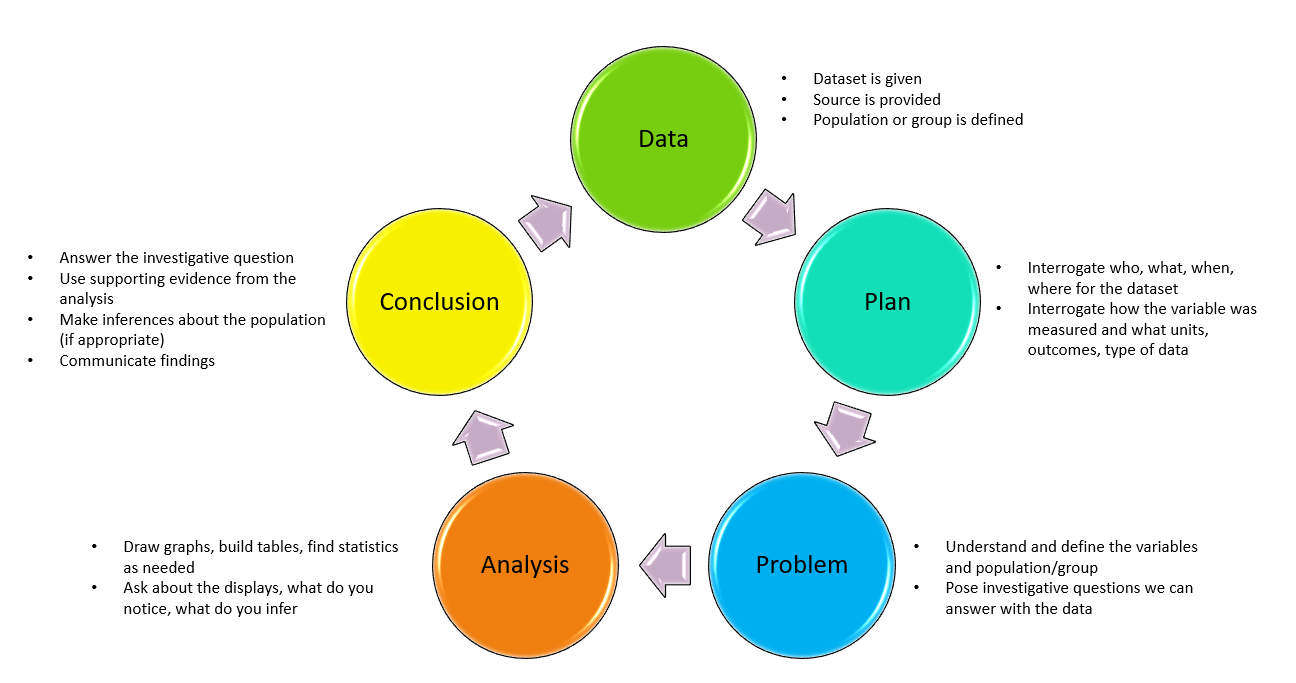
Figure 4.10. The statistical enquiry cycle for provided datasets (Arnold, 2022, p.159)
Curriculum document statements:
These statements are across Year 9 & 10:
- A distribution is formed from all the possible values of a variable and their frequencies. It can be shown using data visualisations that show patterns, trends, and variations, and that include dot plots, bar graphs, frequency tables, box plots, histograms, time-series graphs, scatter plots, and two-way tables.
- A good data visualisation should allow viewers to discern the variable(s) and who the data was collected from, and then, depending on the type of visualisation, additional information such as frequency, proportions, patterns, or trends, and units for numerical variables.
- Creating multiple data visualisations for an investigation
- Selecting appropriate scales for data
- In relationship investigations:
- Sometimes one variable is thought of as predictive of the other variable; then the response or dependent variable is on the y-axis, and the ‘predictive’, explanatory, or independent variable is on the x-axis
- An eyeballed line or curve of best fit can be added for paired numerical data.
- For relationship investigations, drawing an eyeballed line or curve of best fit to predict possible y-values (the response variable) for given x-values (the explanatory variable)
These statements are specifically for Year 9:
- Calculating the five-point summary for numerical data:
- the minimum value
- the value of quartile 1, or Q1
- the value of the median or quartile 2, or Q2
- the value of quartile 3, or Q3
- the maximum value
- Calculating the interquartile range as IQR = Q3 − Q1
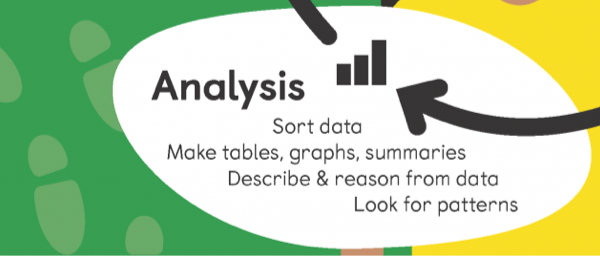
OUR COMMENTARY
These curriculum statements could be read as business as usual for the analysis we do for our given statistical investigation, or the great stuff you already do, except that what is not explicitly stated is the description of data visualisations, though in the conclusion section, it does say to communicate findings… so this implies that description is needed.
There are lots of ideas about describing distributions in the book Statistical investigations | Te tūhuratanga tauanga (Chapter 5 Analysis pp 291-336), and some of the information is shared here.
Depending on how your school approaches statistics currently, you might not explicitly look at box plots until Year 10, and while the “CALCULATION” of the five-number summary is listed in Year 9, schools may take a more flexible view on the purpose of finding this information. Also, be aware that the language is not the language we would normally use in New Zealand. We know Q1 is the lower quartile, and Q3 is the upper quartile. It is good for students to be aware of the different terms, work with what is familiar, and makes sense.
In Year 9, we are building foundational ideas, the building blocks, if you like, for concepts such as working with samples rather than the whole group and making the call in comparison situations, which they learn about in Year 10.
Curriculum document statements:
- Elements of chance affect the certainty of results from observational studies and experiments [experiments are not mentioned anywhere else, so not sure what this means in regards to teaching about experiments or not in Year 9 & 10].
- Uncertainty should be taken into account when making claims.
- Communicating findings in context to answer an investigative question, using evidence
- Providing possible explanations for findings
- Comparing findings to initial conjectures or assertions and existing knowledge
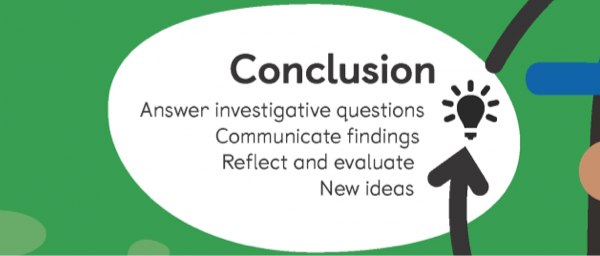
OUR COMMENTARY
These curriculum statements align with what you would expect to be happening in the conclusion phase of the PPDAC cycle.
Bigger picture
As mathematics and statistics departments and faculties, you have the opportunity to ensure that statistics teaching and learning continue to align with best practice and to make decisions about which types of investigations (summary, comparison, relationship, time series) and data collection/sourcing focus (primary, secondary) you want to take for each year.
Pip has worked with three Auckland High Schools to develop activities for teaching statistics at Year 9. There are draft materials with a focus on summary investigations and primary data here, and in progress a series of lessons focusing on relationship investigations for Year 9. This is a deliberate decision and would be backed up with a Year 10 unit focusing on comparison and time series investigations, with a focus on using secondary data.