Interactive Visualizations for Conditional Probability: Eikosograms and Pachinkograms
For an excellent description of Eikosograms and Pachinkograms and their use in teaching conditional probability, see the article by Marie Fitch and Stephanie Budget (“Conditional Probability: Friend or foe?” in the Proceedings of the Tenth International Conference on Teaching Statistics (2018).
Eikosograms:
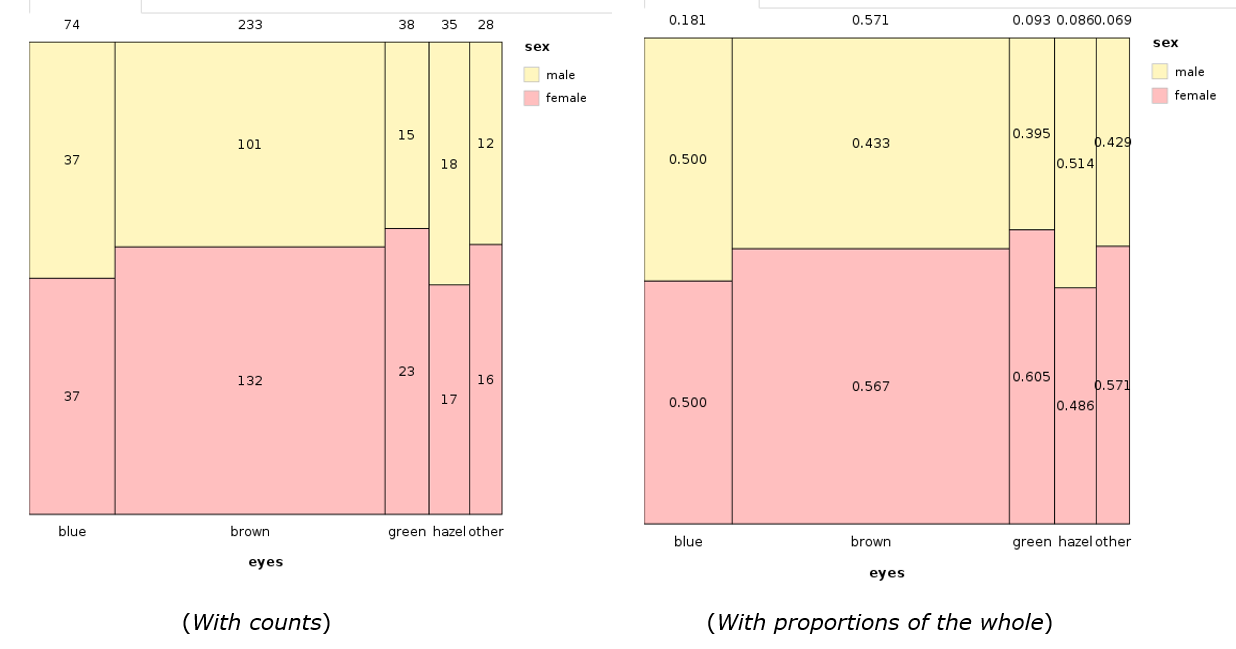
An Eikosogram is a graphical representation of a two-way table of counts (or joint probabilities) which makes the relative sizes of the counts in each table clearly visible by making the area of each cell proportional to the count.

They are useful for seeing relative sizes and conditional proportions/probabilities in the vertical direction. In this example that corresponds to proportions of eye-colour for each each of the sexes (or equivalently, “given Sex=female“, or “given Sex=male“)
Our Eikosogram web-app produces these graphics for data read in by the user.
If you want constitutionality the other way around the other way around a “Swap factors” button reverses it.
which helps for seeing the relative sizes of conditional proportions/probabilities of Sex given Eye colour.
Resources for teaching using Eikosgrams:
From Malia Puloka’s 2017 Teachers Day workshop exploring how to teach the concepts of conditional and joint probability using the Eikosogram. Equally important is the interpretation and verbalisation of proportion and probability statements and the posing of questions, which Malia also looked at. The workshop was based on Malia’s master’s research with Year 13 students.
- Powerpoint
- Pre-task questions: pdf, Word
- Eikosogram activity
- gendereyecolour.csv
- Workshop video …
Pachinkograms:
A Pachinkogram can be thought of as interactive and dynamic tree-diagram.


They are particularly useful for conveying issues in “reversing the order of conditionality”, i.e. converting from pr(A | B) to pr (B | A). They expose the sizes of the probabilities through the widths of the flow-paths, and expose the “proportion of a proportion” idea as you move down the path.
Seeing is believing! In her 2017 Teachers’ Day workshop Stephanie Budgett (University of Auckland) cast a light on common and widespread probability misconceptions. Teaching probability is difficult. Learning probability is difficult. We all have misconceptions that are remarkably resistant to change. This workshop Stephanie presented common probability misconceptions from a variety of disciplinary areas. Participants used Pachinkogram software and the following activities designed to address these common misconceptions and explore these issues.