Suggestions for Teaching Time Series
Why study time series?
Students are always asking their teachers why we have to study this topic. So start the unit by answering this question first!
The primary reason that most people study time series is that they are interested in predicting the future. To do this they need to model past behaviour of a time series and hope that this pattern of behaviour will continue into the future in order to calculate a prediction. The problem is that some time series are just unpredictable, some that are not we can attempt to model.
Predictions of time series are required in many different areas
- Population projections are calculated by Government bodies in order to predict when a new school, hospital, road, bridge, prison or houses will need to be built.
- Economic forecasts, such as share prices or exchange rates are used by financial institutions.
- Weather forecasts are probably the most common types of prediction which we hear about every day.
- Environmental forecasts covering topics like global warming, monitoring populations of species close to extinction, spread of disease, rainfall, temperature etc are calculated by scientists from a variety of disciplines
As a Government Statistician I produced a variety of projections including
- Ocean wave heights for engineers who were trying to develop machines to harness wave energy and needed to know wave heights as from this they could calculate the forces that the machines would need to withstand.
- Prison population projections by type of prisoner ( lifer, remand, short-term, young offender, etc.) so that decisions about where and when to build new prisons could be taken
- Predictions of the number of prescriptions dispensed nationally. The government subsidise each prescription dispensed so from the projections could work out a budget.
- Predictions of hospital waiting lists for a variety of procedures. These predictions were not only used as part of hospital planning but also were input into medical training programmes to ensure that the right number of specialists were being trained in the right areas.
What are time series?
Provide a selection of time series for your students to discuss in groups. Some possible sources for these are
- Statistics NZ
- NZ
- Datamarket
- American Statistical Association
- Google trends
Allow students to develop their own descriptions before you introduce correct terminology. Encourage students to speculate about possible reasons for the variation that they can see. Give the same time series to different groups – it is interesting to see the different features that different groups will notice. Aim to include a range of time series with increasing complexity from
- Stationary (no trend) time series with little variation
- Time series with no long term trend but some seasonality
- Time series with a linear trend
- Time series with a linear trend and seasonality
- Time series with a non-linear trend and seasonality
- Time series with a piece-wise trend , with and without seasonality
- Time series with linear trend and cycle
- Time series with a non-linear trend and cycle
- Time series with no discernible pattern i.e. one that is unpredictable
Examples of time series with some of these characteristics are given in Appendix 1. Some of the time axes are unquantified; this is deliberate and designed to stimulate debate about what the unit of measurement might be from the shape of the variation. Don’t worry too much about the meta data at this stage either, the main focus should on developing students’ skills of describing time series patterns.
Terminology
Having exposed students to a variety of time series which they described using their own vocabulary, re visit the same time series and repeat description of time series but this time using the correct terminology.
Terms to cover include:-
Trend – short term and long term. The long term trend is the most slowly changing component of the series. The trend can be either increasing or decreasing over time and it may be linear or non-linear. A short term trend is a temporary shift which may or may not have been caused by a one-off unusual event; once this event has passed the previous long term trend direction is normally resumed.
Seasonality – remind students that a ‘season’ might be a day, a week, a month, a quarter or any repeating time period.
Residuals – ask students to identify any unusual residuals, which is a residual which is greater than 10% of the overall variation in the raw data series. Any unusual values, thus identified, warrant some further investigation. Perhaps this unusual value represents an error in the data, perhaps it occurred as the result of another related unusual event; students will need to research events around the time of the unusual value to conjecture about possible reasons. Conjectures are fine, proof is not required.
Peaks and Troughs – terms used to describe local maxima and minima in a time series. Students should identify if peaks or troughs occur at the same point in the seasonal cycle and again conjecture about possible reasons for this.
Cycle – A cycle is a recurrent wave-like pattern. The period and amplitude of a cycle is neither fixed nor predictable. Thus we can describe cycles as irregular wave-like patterns in series. Many financial and economic time series have cycles that are related to changing business conditions. Students should be exposed to time series with cycles but they will not have to model them as the techniques required are far too complex.
Smoothing Techniques
Hopefully some students will have struggled to adequately describe the time series you have exposed them too, particularly if you have presented your time series with equal length axes as opposed to a longer x axis.
The overall trend is often hard to identify particularly in a series which is dominated by seasonality. In order to view just the trend without the distraction of the seasonality a number of smoothing techniques are available. If you google smoothing techniques you will see there are many. The student tutorial provided in Appendix 2 introduces a few smoothing techniques, namely
- Moving Mean
- Weighted Moving Mean
- Exponential smoothing (=0.5)
- Exponential smoothing (=0.1)
Through completion of this tutorial, students can see the effects of smoothing and this lays the foundation for using the time series module of iNZight, which uses a smoothing procedure called Holt-Winters. A Teacher’s Guide to Holt-Winter’s is attached at Appendix 3. Students do not need to know how Holt-Winters works but they do need to understand that it is a refinement of exponential smoothing, so it can be helpful to go through the process of calculating smoothed values by hand before they are exposed to the software that will handle the calculations for them. Without this step, the software becomes a ‘black-box’ and an important component of the student’s learning trajectory will have been omitted. Robust research also supports the importance of this step.
Description of overall trend
With the move to using real data in the teaching and assessment of time series, the task of describing the overall trend of the time series has become a lot more complex. No longer can scaffolding be provided by using the coefficient of a linear regression model and the thorny issue of how many pieces comprise the time series emerges. This issue is the subject of a separate paper currently being prepared by the NZSA Education Committee and will be posted on Census@School website when finalised but the advice, in short, is to train students to describe the long term trend of their time series, which means they should not be distracted by short term variations which will always be present. See examples of acceptable and unacceptable trend descriptions below.
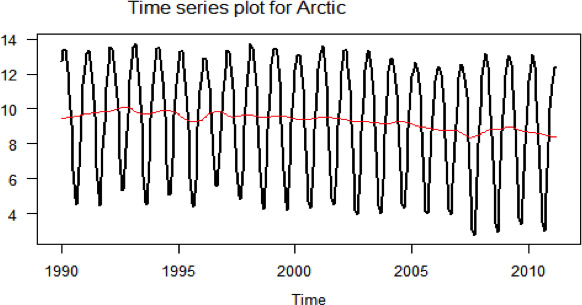
“Looking at the smoothed values, there appears to be a slight increasing trend in the mean area of Arctic sea ice from Jan 1990 – Dec 1992, followed by a decline in the mean area of Arctic Sea Ice during 1993, a slight increasing trend in 1994, then general decreasing trend from 1995-2011(with a more rapidly decreasing trend than the rest of the years at the second half of 1995 and 2007 respectively).”
This is an unacceptable description of the trend as it focuses too much on short term variations.
“Overall the trend in the mean area of Arctic sea ice from 1990 to 2010 is slightly decreasing.”
This is an acceptable description of the overall trend; the only addition to this might be some comment quantifying the change, for example,
“The area of Arctic sea ice shows a very gradual decline over the period 1990 to 2010. The trend level has fallen from around 9.5 million km2to around 8.5 million km2 over the time period.”
Predictions
If a student understands the underlying concepts of the model of their time series they can then make sensible statements about their predictions. For example, how far into the future are the predictions likely to be reliable. Are there any indications that past patterns of behaviour are not going to continue? Are predictions available for any related time series? How do these predictions compare to those calculated? What do the width of the confidence intervals tell you about the predictions? What do the width of the confidence intervals tell you about the fit of the model in general? Remember “All models are incorrect – some are useful” (Box, 1987)
Predictions are especially problematical if there has been an unusual value near the end of the time series and will be reflected in wide confidence intervals.
Model robustness can be tested by removing the last few values of a time series, re fitting the model and investigating how the ‘predictions’ compare with actual data values. If the actual data values fall within the prediction confidence intervals, model robustness is supported.
Interpretation and Conjecture
Encourage students to explain the features they have observed in their time series. Some features will be easier to explain than others, for example
Possible explanations for seasonal effects
- Ice cream sales – more sold in summer, fewer in winter
- Power usage – in NZ more power in winter, less in summer, but compare this with countries that have hotter climates. Often power usage is greater in summer because of air conditioning.
- Alcohol sales – often peaks around Christmas and New Year.
- Retail sales – again peaks around Christmas are common. Perhaps compare with countries who do not celebrate Christmas, are their seasonal patterns different?
- Weather aspects – is rainfall seasonal?
Possible explanations for changes in long term overall trend
- 2008 Global Financial Crisis. Many financial series show dramatic disruptions to overall trends around 2008.
- Global Warming. Consider related series.
- Health Scares – SARS, Asian flu, AIDS, Ebola, Mad Cow Disease. These show up well on Google trends.
- Acts of Terrorism – such acts can dramatically affect airline travel and other aspects of tourism.
- Major Sporting Events – Olympics, Commonwealth Games, Football World Cup, Rugby World Cup.
- Investigate other research to see if it confirms or refute a suspected overall trend change.
Interrogative Reasoning
At the end of an initial analysis of a time series students should consider further questions inspired by their investigation. For example, if conditions changed can they suggest how this might affect predictions? Some time series may reflect patterns shown in related time series but the pattern is lagged – i.e. the pattern in one series is several time periods behind that in another series.
In the Food for Thought data set a drop in the four retail spending series – supermarkets, fresh food, takeaways and restaurants – was found but the drop occurred in each series at different times. In this scenario a reduction in fresh food spending was the first to fall, followed by takeaways, then restaurants and supermarkets. Thus if in the future a drop is observed in fresh food spending it may be an indicator of falls to come in other related time series.
What happens next in time series analysis?
It is always good to be able to explain to students what happens next in a topic. In time series it generally means moving on to more complicated models that will enable them to model some of the time series students saw at the beginning of the unit. Models covered in a Stage 3 Time series course at the University of Auckland include:
- Autocorrelation – inclusion of an element in the model for correlation between values
- Transformation of series – for time series with a non-constant variation
- Alternative smoothing techniques
- Harmonic models – using trigonometric functions to model trends
- ARCH models – autoregressive conditional heteroscedasticity models, used to model time series whose variation changes over time.
Time Series for Teaching and Assessment
Do use a variety of time series with linear & non-linear trends, fluctuating variation, cycles and large residuals in your teaching of time series.
Do not use these more complex time series in your assessments. Such time series are beyond the capability of many 3rd Year University students so don’t expect your secondary school students to cope.
This does pose a problem as real data is not often nicely behaved, yet teachers are encouraged to use real data in their assessments.
Another problem is that teachers in the conditions of assessment guidelines are requested to provide multivariate data sets for time series assessments from which students must select one time series to analyse. It is an extremely difficult and almost impossible task to find a multivariate data set with all variables providing analysis opportunities of equal difficulty. It can also represent a huge marking workload when students select different series. I suggest teachers limit the multivariate data set to 2 or 3 variables maximum.
Some teachers are also using alternative forms of assessment such as a presentation rather than a report for the time series internal in an attempt to reduce the marking workload.
The hierarchical levels of reasoning referred to in this document are taken from a framework for the development of reasoning in time series constructed for my Master’s thesis which is due to be submitted at the end of January 2016.
Rachel Passmore
November 2015