See our
live dashboard
Search
Menu
Take Part
Close Search
Search this site
Search
Submit
Close Menu
Data
Resources
Overview
About
Media
Privacy
News
Contact
Search
Take part
Resources by Ruth Kaniuk
Show filters
Close filters
Probability experiences, Level 1 and before
Probability distributions Level 5
Visualizing variation with Tinkerplots
Using TinkerPlots to aid the understanding of uncertainty
Tinkerplots for probability modelling
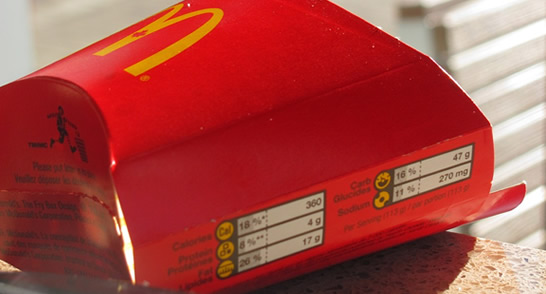
McDonald’s food nutritional study
Investigating bivariate measurement data using iNZight
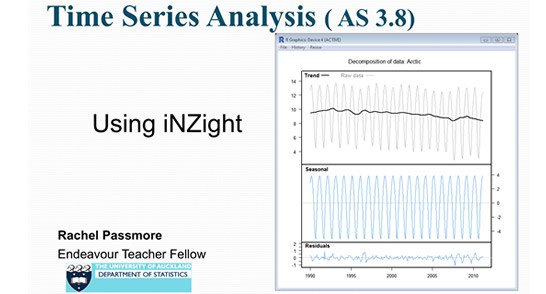
Time Series Analysis using iNZight