Describing the trend in a time series (2016)
Time series and their trends needs careful attention
The Mathematics and Statistics Facilitators are providing this document to assist teachers, with the aim of clarifying the amount of detail students should provide in describing trend, in the learning associated with Achievement Standard 91580: Investigate time series data. The NZ Statistical Association’s Education Committee has also had input into this document.
The facilitators welcome feedback on this document, and see it as part of an ongoing process.
The document aims to clarify best practice in describing the overall trend and other significant components of a time series for NCEA level 3 students. Best practice at NCEA level 3 is a subset of, and consistent with, the best practice used by professionals, based on visualisation (finding information about data from graphics), and the assumption that the time series used can be modelled as containing three parts: trend, seasonal component, and residual. Students will be using this to describe the variation of the time series over time.
Time series are prevalent in many professions and the media. Appropriate interpretation of time series is therefore an important concept for students to learn. Every time series comes with its own context, dataset, and graphs. Students should engage with and explore them readily.
This document does not cover the forecasting aspect of the time series Achievement Standard, and does not discuss other options like using several related time series.
Guidance exists in several documents
The Achievement Standard 91580 Mathematics and Statistics 3.8 Investigate time series data contains these curriculum links:
- finding, using, and assessing appropriate models (including additive models for time-series data), seeking explanations, and making predictions
- using informed contextual knowledge
The Standard also contains:
Using the statistical enquiry cycle to investigate time series data involves:
- selecting a variable to investigate
- selecting and using appropriate display(s)
- identifying features in the data and relating this to the context
- finding an appropriate model
- using the model to make a forecast
- communicating findings in a conclusion.
The Conditions of Assessment contains these items:
- assessment of this standard involves an investigation.
- sufficient time should be allowed for students to complete the investigation.
- students use a time series data set containing multiple variables.
- background information related to the data set is to be provided to the student and the context should be one that is accessible and able to be understood by the students. This background information should be provided in advance to allow time for students to research the context to gain that understanding.
Moderation clarifications
Students need to provide evidence of each component of the statistical enquiry cycle detailed in Explanatory Note 3 of the standard:
- selecting a variable to investigate – Sufficient time needs to be allocated for students to research the context and acquire appropriate contextual knowledge. At all grades, the students need to select a variable to investigate and to develop a question which is informed by this contextual knowledge.
- identifying features in data – Features in the data need to include a quantitative description of the overall trend using the smoothed data, for example ‘The trend for the number of text messages sent by male mathematics teachers in NZ increased from 1200 per quarter in the first quarter of 2008 to 2050 in the last quarter of 2013’. Features in the data also need to include a description of the seasonal pattern.
- using the model to make a forecast – Students need to make a forecast for at least one future time period in context. It is not sufficient to just produce a table of values. The accuracy of the forecast could be discussed by referring to the displays and by using the contextual knowledge of the student research.
Required quality of student response
For Merit, students need to justify all findings with reference to evidence from the displays and statistics and link the purpose and findings to their research.
For Excellence, students need to integrate the statistical and contextual knowledge gained from their research, throughout the response, and also reflect on the process, which could be shown by considering other relevant variables, evaluating the adequacy of the model or showing a deeper understanding of the models.
The Mathematics and Statistics Clarifications and Conditions of Assessment require informed contextual knowledge and references to sources at all levels of achievement (as stated in the assessment sched-ule). Sources may include: informed personal experiences supported by conversations with relevant stakeholders; other primary sources; publications; internet sites; other media.
A clear path for time series analysis
Every time series is different, but students could.
1. describe the overall behaviour of the trend, and quantify this by stating values of the trend, with their dates. The student should give the y-values of the trend at these points.
1.1 The student’s initial statement could be simply a reflection of the section of the time series that is available, and answers the question, “What level was observed at the start of the series, and what level was observed at the end of the series?”
1.2 The student should describe the main features of what happens in between the start and end points. Within the overall increase, decrease, or absence of change in level, the student may be able to identify key points. These may be points when the gradient of the smoothed values changes to a new value for a sustained period (at least one seasonal cycle, but preferably more than one). For example, the level may have fallen between start and finish of the time series but this overall trend may include a period of increase followed by a period of decrease. If the overall trend or sections of the overall trend are non-linear, students should note this and may go on to describe how the rate of change increases or decreases as key points are approached.
Students should comment on changes in behaviour that last for a sustained time period. The length of the sustained period is a subjective decision and needs to take account of the length of the seasonal cycle and the number of data values available.
Students can smooth the smooth, by eye (or pen) and comment on these section breaks.
2. describe the seasonal component of the time series, quantify this by stating values for the seasons, and describe the variation in seasonal behaviour across the length of the time series.
3. describe any other features in the time series. Students could comment on obvious spikes or steps, and investigate possible causes for these.
4. compare the size of the variation in the three parts of the decomposition. The student can assess the strength of trend and seasonal component by comparing the size of the variation in them to the size in the residual. Often this is easier to do visually from the graphics.
If a student uses software to fit a multiplicative (rather than additive) model, they may see that the size of the variation changes across the series. They could describe what they see.
5. research and suggest contextual interpretations for any patterns, variations or unusual data values noted. Students could identify a factual basis or supporting research for the suggestions.
6. comment on how well the model, ie the decomposition, deals with the time series.
The student can look at the graph of the original time series, note what they see in it, and state how well the decomposition reveals this.
The analysis of time series, inspired by The New Zealand Curriculum, can be described as: ‘Look carefully, describe what you see, and relate it to the context’. Students need to develop skills in interpreting graphs, using appropriate statistical language for describing and relating, and being aware of what algorithms and software can and cannot do. Students need to develop skills in purposeful and meaningful investigations, researching into context, and posing appropriate investigative questions.
All time series are different. Some of them behave in ways that algorithms do not cope with well. For student learning, these time series may be useful. Care must be taken to use appropriate tme series data sets for assessment, so that students can have the opportunity to present their best evidence for the task presented. Problematic time series like these may contain large spikes, steps, or major changes in seasonal pattern.
Further information available
Level 3 Conditions of Assessment: see pages 1 and 3, and
Internal assessment resource: Food for thought: in
https://ncea.tki.org.nz/Resources-for-Internally-Assessed-Achievement-Standards/Mathematics-and-statistics/Level-3-Mathematics-and-statistics
https://ncea.tki.org.nz/content/download/3746/12099/file/maths_stats_CoA_L3_jan16.doc
The Statistics New Zealand Time Series Resource. This includes decompositions, graphs, commentary, and links, on a wide variety of Statistics New Zealand’s time series datasets:
https://new.censusatschool.org.nz/resource/time-series-modelling/
The data for the example used from this below is at:
http://www.stats.govt.nz/infoshare/SelectVariables.aspx?pxID=d63bdd3f-94c5-4cfb-9e7d-efc2b0813d11
Time series methods for teachers and students: a resource from Rachel Passmore:
https://new.censusatschool.org.nz/resource/timeseries-methods-for-teachers-and-students/
The last page has an example from the Statistics New Zealand resource.
Feedback:
We welcome feedback on this document. Please send to derek.smith@otago.ac.nz
Example: The volume of alcohol available in beer per quarter
This example comes from the Statistics New Zealand Time Series Resource as identified on page 3. The time series used here is:
Total volume of alcohol in beer available for consumption in million litres per quarter (‘Volume’)
The graphs below are from this Statistics New Zealand Time Series Resource.
In the Volume time series below, students could describe the overall fall in the volume of alcohol in beer available for consumption during the time period of the series: 1995 to 2015. However, within that decrease, students should comment about the more rapid decline between 1995 and 2000, then the period of slow recovery between 2000 and 2009, and then the decline to 2015, with a rate comparable to that observed in the early years of the time series. This time series can be seen as containing three fairly straight sections. Trends in other series will consist of curved movements.
Here is a possible student description of the trend:
‘The trend in this time series can be seen as having three fairly straight sections. The total volume of alcohol in beer available for consumption has fallen from around 3.8 million litres per quarter in 1985 to around 3 million litres per quarter in 2015. This decline to the lower level occurred mainly between 1985 and 2000. Between 2000 and 2009 the volume of alcohol in beer available for consumption showed a slight increase. Since 2009 the volume available has declined again, dropping from around 3.4 million litres per quarter to only just above 3 million litres per quarter in 2015.’
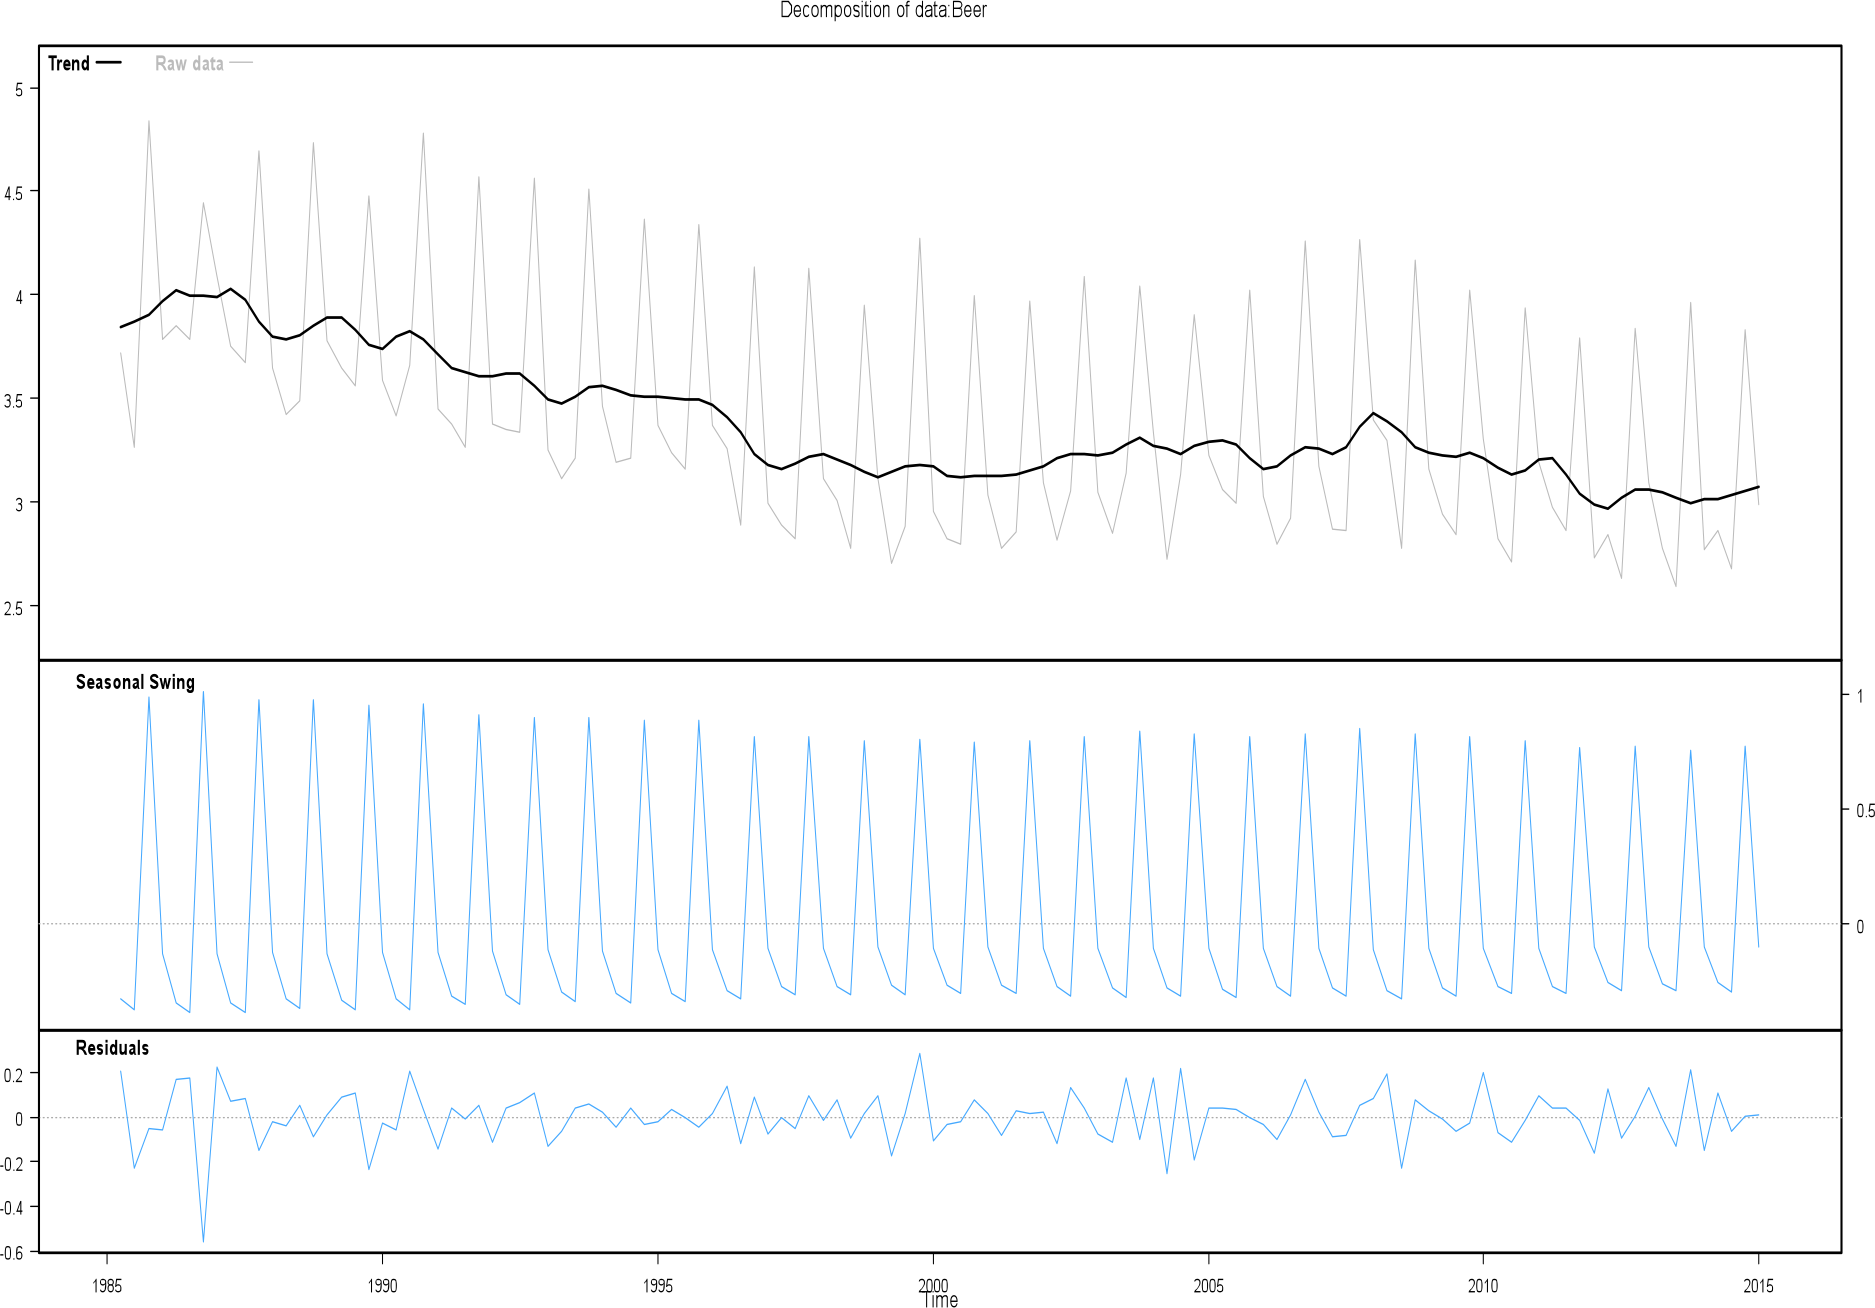
Figure 1: Decomposition of the Volume series from the Statistics New Zealand Resource.