Stick Figure Data Cards
This population of stick people was created using data from the CensusAtSchool 2015 database.
For the data cards, rather than put/indicate gender on the card, a fictional name, taken from the names of children entered in the 2015 Auckland kids marathon was used.
The relevant questions from the CensusAtSchool 2015 survey are:
Q1, Q2, Q17, Q27 cellphone, facebook, snapchat, Q31 TV, and Q32 reading (the questions can be found here).
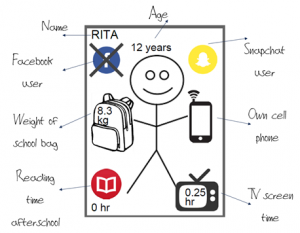
The diagram below shows what each part of the data card represents:
Students can explore stickland virtually and ask investigative questions about stickland people. Students choose stickland people for their sample, they can then sort virtually and if required download the sample data into iNZight, CODAP, csv.
For some great teaching notes and ideas for using data cards, check out Anna Fergusson’s Blog Teaching Stats is Awesome