Data Cards
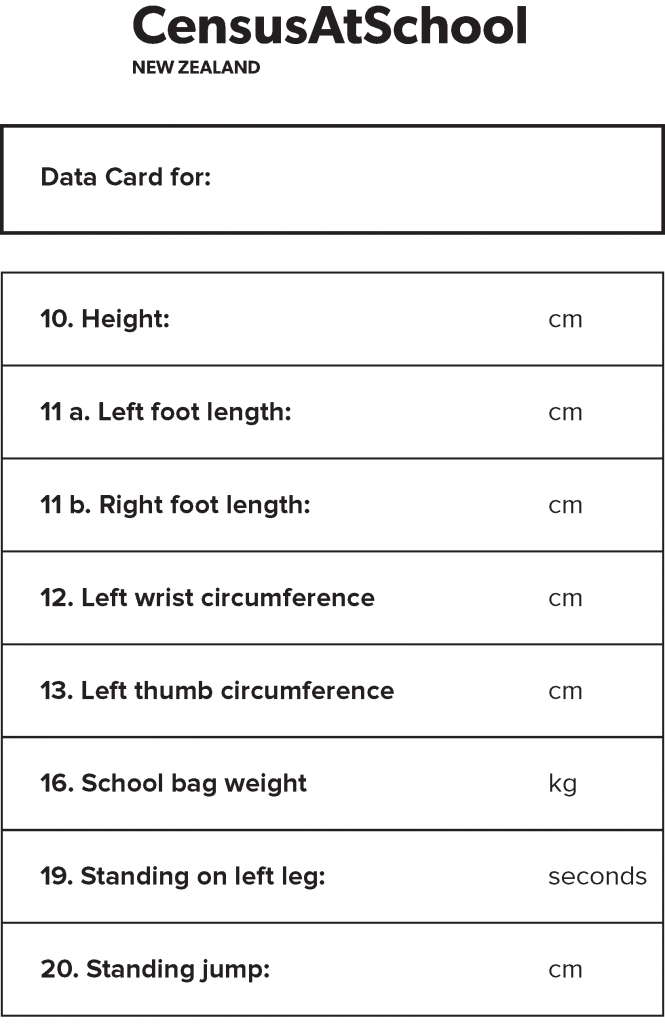
Data card from the Primary Teacher Guide CensusAtSchool 2023, p. 38
CensusAtSchool Data Cards
More Data Cards
What are Data Cards?
Data cards are a way of storing data about a specific person, object, or non-physical entity. In this system, each individual card represents a single item.
To ensure straightforward future analysis, the data for every entity is recorded using a consistent format. Information from data cards can also be transferred into a spreadsheet for deeper analysis using statistical software.
While data cards are excellent sources of secondary data, they can also be used for primary data collection. For instance, CensusAtSchool data collection materials typically feature a dedicated data card for students to record their measurements.
Using Data Cards
Data cards are a good way of introducing students to using secondary data. They allow for hands-on activities such as making data visualisations to analyse the data for an investigative question. The complexity of the data cards should change depending on the year level aimed at. The CensusAtSchool 2023 database data cards are examples using secondary data.
Whether the secondary data is provided by the teacher or sourced by the students, the information required for understanding about the data collection is within the information we refer to as the contextual knowledge about the dataset. Contextual knowledge includes:
- The group or population that the data was collected from
- When, where and how the data was collected
- The original purpose for collecting the data
“Planning” for secondary datasets includes interrogative questions to help with developing a deep understanding of the data that would be available to use. The “overall for the dataset” interrogative questions in the next section help us with understanding about the data collection and align with the contextual knowledge ideas listed above. Regardless of whether the teacher provides the data or the students source the data themselves, contextual knowledge is important. The “overall for the dataset” interrogative questions also include who the data was collected from (adapted from Arnold, 2022, p. 90).
The final part of finding out about the secondary dataset, the data cards, is to identify and interrogate the variables in the dataset. To do this the “specific to the variable” interrogative questions in the next section are used.
PLAN/DATA: Interrogating secondary datasets
It is good practice to interrogate any secondary datasets that are used with students. Depending on what you are trying to achieve, it could be built into the teaching and learning sequence, or it could be background research you do before using the dataset with students.
The following interrogative questions provide a good starting point to understand the data, what was collected, how it was collected and who it was collected from.
Overall for the dataset:
- Was the data collected using an observational study or an experiment (from year 9)? (1. Method)
- Who was the data collected from? (2. “Who”)
- Who collected the data? (1. Method)
- When was the data collected? (1. Method)
- Where was the data collected? (1. Method)
- What was the purpose for collecting the data? (Initial investigator’s problem/purpose)
Specific to the variable (3. What and how):
- State the variable.
- What was the data collection or survey question asked to collect the data?
- How was the variable measured?
- What are the units, if any, for the variable?
- What are the possible outcomes for the variable?
- What type of data is it? Categorical or numerical?
(Arnold, 2022, p. 79)
The CensusAtSchool 2023 database data cards should be interrogated before they are used by students so that they become familiar with the variables that are available for each data card set.
Two useful documents to support this are the 2023 CensusAtSchool questionnaire, and the 2023 variable list.
PROBLEM: Posing investigative questions
When we start with a provided dataset, for example, using the CensusAtSchool 2023 database data cards, the way we work through the PPDAC cycle is different from when we are collecting primary data.
Using the statistical enquiry cycle for a provided dataset may follow the approach shown in Figure 4.10 below.
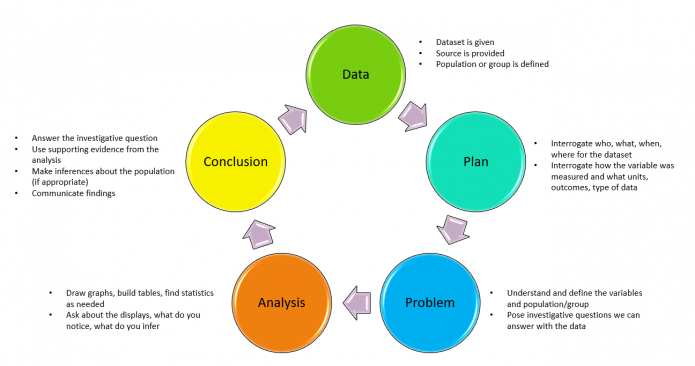
Figure 4.10. The statistical enquiry cycle for provided datasets (Arnold, 2022, p. 159)
Investigative questions are posed once the data has been interrogated and students understand the variables which are available in the dataset, and who the data was collected from.
ANALYSIS: Creating & describing data visualisations
Early data visualisations can be made with data cards, from year 1 students can sort and order the data cards to summarise data. Data cards are an enactive mode (Bruner, in Graham, 2006), where students are manipulating objects and building spatial awareness. Data cards are foundational to dot plots, bar graphs, histograms, scatter plots and two-way tables. They can be used in summary, comparison and relationship situations. For more on the development of these types of data visualisations see Statistical investigations | Te Tūhuratanga Tauanga (Arnold, 2022) analysis chapter – dot plots pp 229-237; bar graphs pp 237-243; histograms pp 254-248; scatter plots pp 275-280; two-way tables pp 266-271.
Examples below using the different data cards.
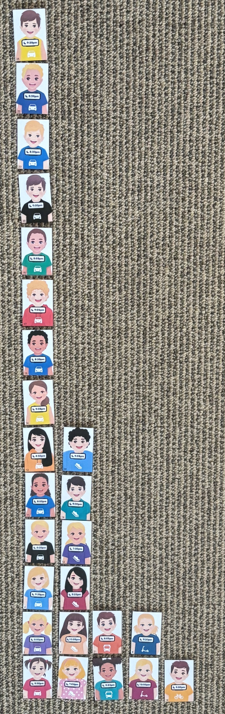
Y1-3 sorted by travel method to school
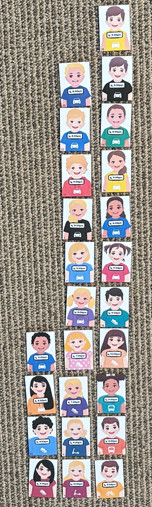
Y1-3 sorted by hair colour
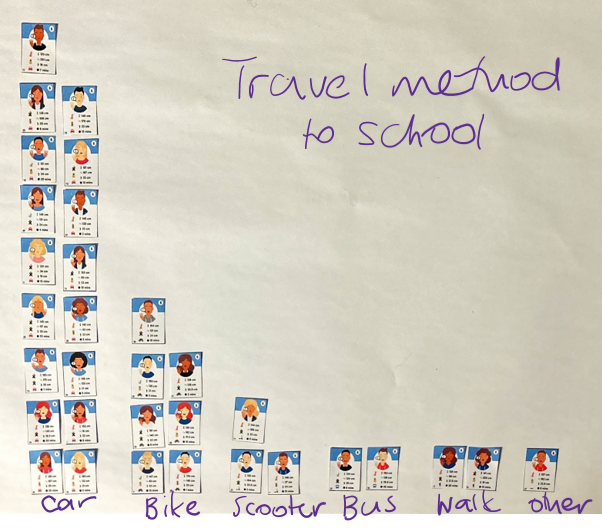
Year 4-6 (year 6 only) travel method to school
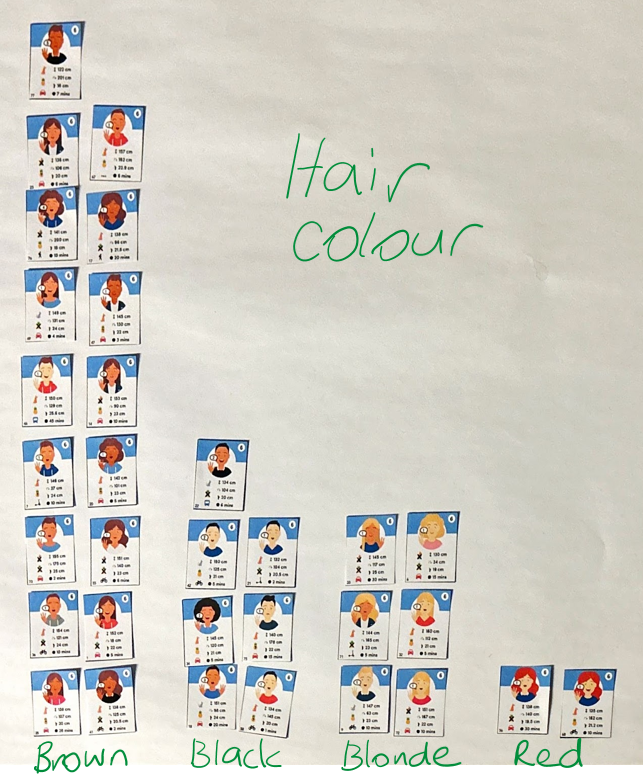
Year 4-6 (year 6 only) hair colour
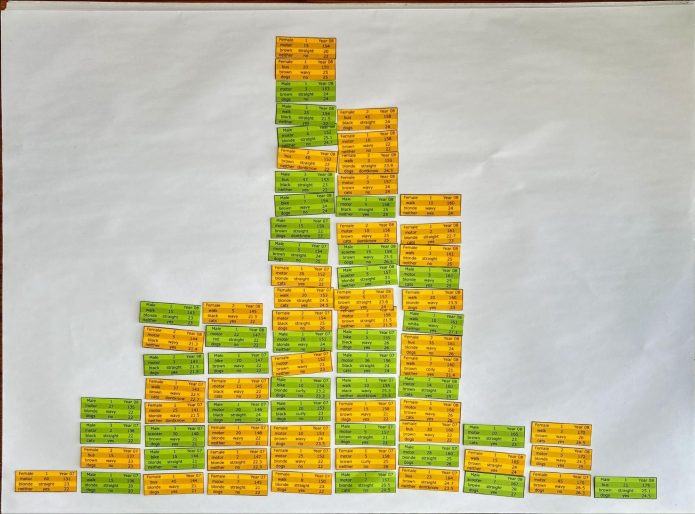
Year 7-8 data cards – set 1 – sorted by height (5 cm intervals)
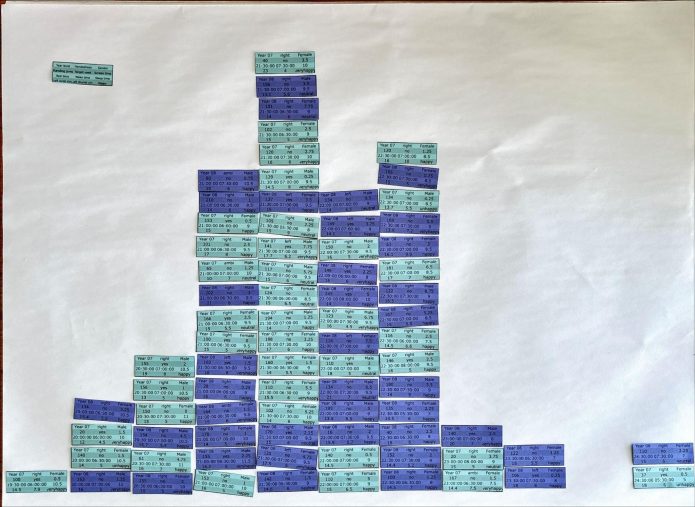
Year 7-8 data cards – Set 2 – sorted by bed time