Data Viewer Help
Text instructions:
Firstly, you must agree to the conditions of use before beginning.
You are at the beginning of the statistical investigative cycle.
Posing an summary question
Begin by writing the statistical question you want to investigate with the correct variable of interest. It may be helpful to review the list of variables from the database of interest.
A summary question involves one variable of interest. For example:

Planning involves selecting the population or sub population to sample from. You will need to decide what size sample you need. The maximum sample size is 1000.

Clicking on Get data will generate a random sample from the population or subpopulation selected.
![]()
Once you have selected a sample, you can analyse the sample by producing plots of the data. This type of summary question requires only one variable to be entered.


Getting summary statistics
Selecting the add summaries button will provide a 5 number summary of the sample. The standard deviation (a measure of spread) and the number of observations (sample size) are also included. This will allow you to use exact sample statistics for your conclusion.

Refresh and Resetting data
Refreshing data will select another sample from the database with the same sub-population categories.
![]()
Resetting will clear the sample selected and allow the selection of a new sample.
![]()
Posing a comparison question
This type of question compares two different groups. After you have a comparison question and selected variables, select a database you want to sample from. It may be helpful to review the list of variables from the database of interest.
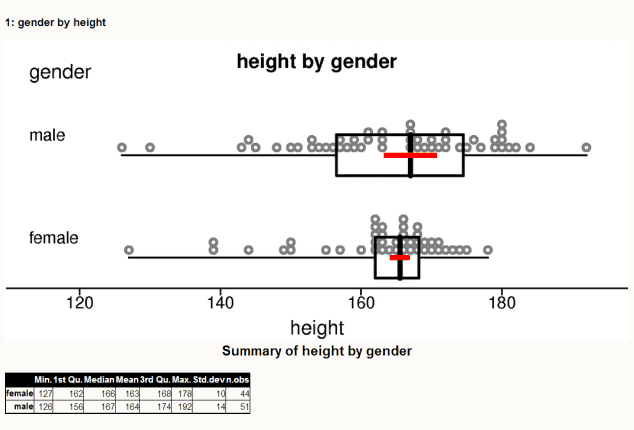
Selecting the year 12 student button will include informal confidence interval for the population median on the box plots.

Analysis done after selecting a sample will use the original sample selected unless you select the Refresh Data button.

The informal confidence intervals for the population median are shown in orange around the median of the box plot. The box plot is constructed from a five number summary of the sample and overlays a dot plot of the data.
Posing a relational question
This type of statistical question looks at relationships between two variables. First select a sample from a database. Analysis done after selecting a sample will use the original sample selected unless you select the Refresh Data button.

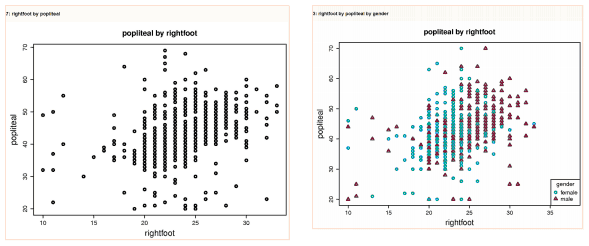
Scatterplots are appropriate graphs for visualising relationships between variables.

Plots may be further analysed by a third variable for additional insight into the data.

